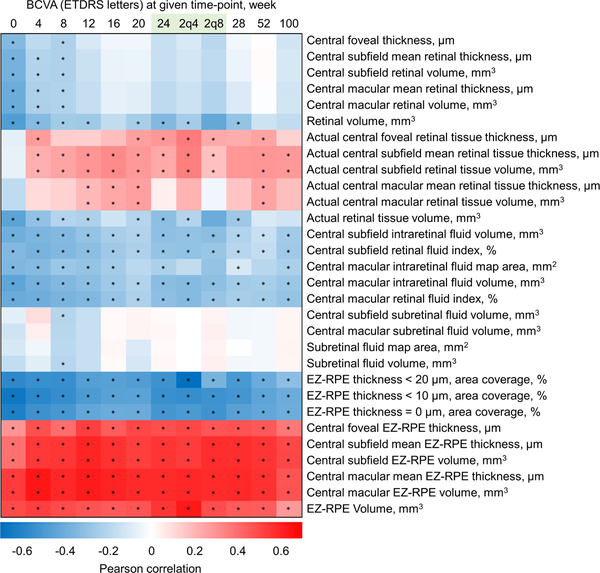
Figure 3. A heat map representing the Pearson correlation coefficients between best corrected visual acuity (ETDRS letters) and OCT retinal parameters from baseline through week 100.
Each colored rectangle represents the degree of correlation coefficient at specific week; positive correlations are filled in red whereas negative correlations are filled in blue. Correlation coefficients are depicted according to the shown color scale shown at the bottom. Superimposed asterisk indicates the statistical significance of P < .05. At week 24, separate 2q4 and 2q8 arms are also shown. Central subfield and central macular ellipsoid zone (EZ) to retinal pigment epithelium (RPE) parameters demonstrate a consistent moderate correlation with best corrected visual acuity (BCVA) at given week. Actual central subfield and central macular retinal tissue thickness/volume parameters demonstrate a weak positive correlation beyond week 4.

