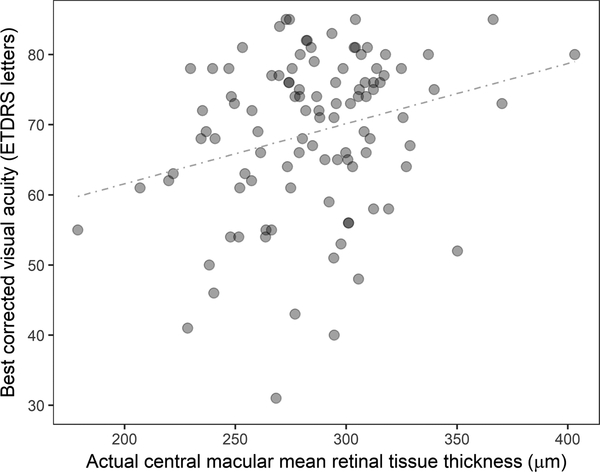
Figure 5. Scatterplot showing the relationship between actual central macular mean retinal tissue thickness and best corrected visual acuity (ETDRS letters) at week 20 (include both 2q4 and 2q8 arms).
The actual mean retinal tissue thickness represents mean retinal tissue thickness excluding both intraretinal and subretinal fluid (i.e., equivalent to the mean retinal thickness of diffuse, non-cystic retinal thickening). The graph demonstrate a weak positive correlation between two parameters (the regression coefficient is r = 0.264, P = .007) at week 20.

