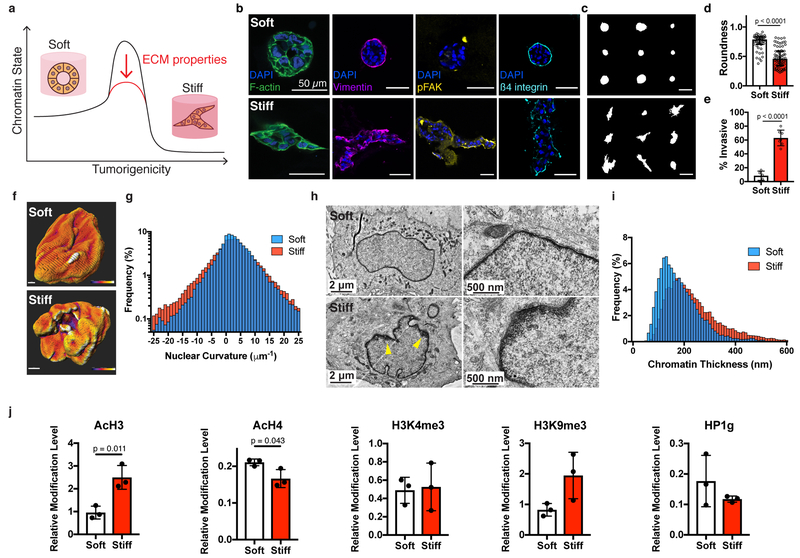
Fig. 1 |. Nuclear and chromatin alterations accompany phenotypic changes induced by ECM stiffness.
a, The hypothesis underlying this study is that ECM properties can stabilize normal phenotypes or make phenotypic transitions more permissive through chromatin alterations. b, Immunofluorescence staining for F-actin, vimentin, phosphorylated FAK (Y397), and β4 integrin in MCF10A acini after 14 days in soft (top) or stiff (bottom) matrices (representative images selected from 15, 3, 5, and 5 images per group respectively). c, Representative outlines of cell clusters from soft (top) and stiff (bottom) matrices. d, Quantification of roundness of cell clusters from at least three independent replicates (median ± 95% C.I.). Significance determined by Mann-Whitney test. e, Quantification of invasive clusters (n ≥ 5, mean ± S.D.) Significance determined by unpaired t-test. f, Color map of nuclear curvature for cells in soft (top) and stiff (bottom) matrices. Scale bar represents 2 μm and color bar ranges from −20 to 20 μm−1. g, Distribution of curvature values, showing more regions of extreme curvature for cells in stiff matrices. Distributions were significantly different by Kolmogorov-Smirnov test (p < 0.0001, n ≥ 11). h, TEM micrographs of nuclei from cells in soft or stiff matrices at 2,000X (left) and 10,000X (right) magnification (representative images from at least 16 images per group). i, Distribution of measured chromatin thickness at each pixel around nuclear boundary for at least six nuclei in each group. Distributions were significantly different by Kolmogorov-Smirnov test (p < 0.0001). j, Western blot quantification of histone modifications normalized to total H3 levels (mean ± S.D.). Three independent replicates were used and significance was tested using unpaired t-tests.

