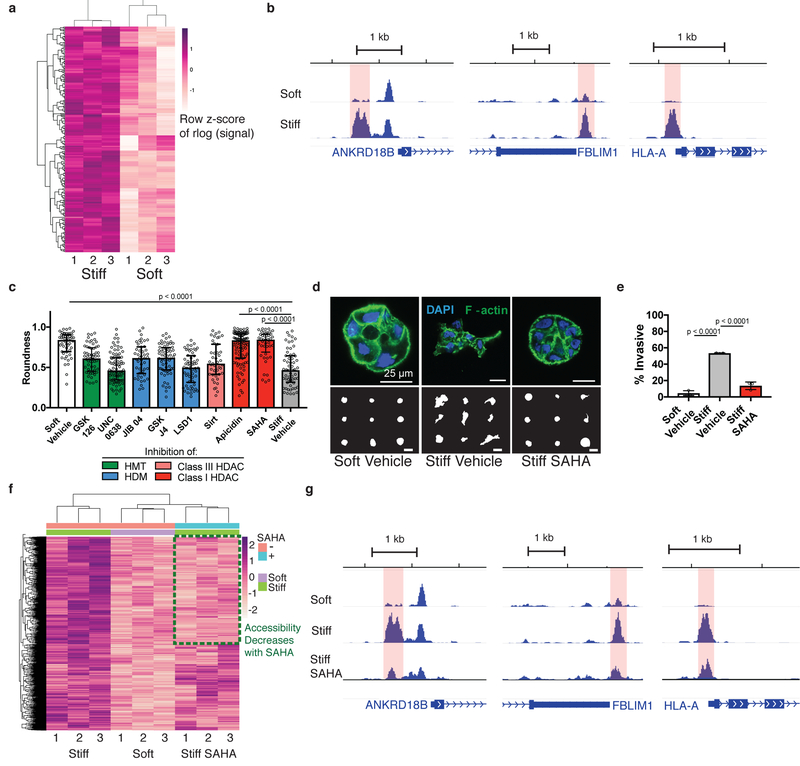
Fig. 2 |. Chromatin accessibility changes are associated with normal and tumorigenic phenotypes.
a, Heatmap of 1658 regions with differential accessibility. Each row represents a differential region, each column is one of three biological replicates of soft or stiff conditions. b, Representative genome browser tracks of significantly differentially accessible regions (highlighted). c, Quantification of roundness for small molecule inhibitors of histone modifiers. Three independent replicates were used for each condition, significance was determined by Kruskal-Wallis test followed by Dunn’s multiple testing correction (median ± 95% C.I.). d, Confocal immunofluorescence images of clusters in control matrices and treated with SAHA (top, from at least 22 images per group) and representative outlines of clusters (bottom). e, Quantification of invasive clusters (n = 3, mean ± S.D.). Significance determined by one-way ANOVA followed by Dunnett’s multiple testing correction. f, Heatmap of 1658 differentially accessible regions between soft and stiff control matrices with signal for SAHA-treated cells in stiff matrices. Green box represents regions that are more accessible in stiff control and less accessible after SAHA treatment. g, Representative genome browser tracks of regions that are more accessible in stiff control matrices than soft control matrices and are less accessible upon SAHA-treatment (differential region highlighted).

