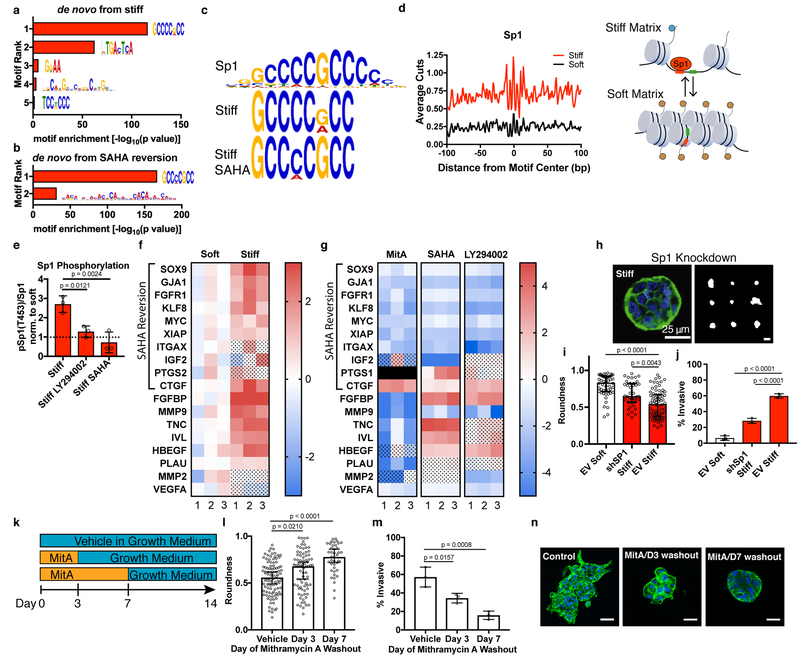
Fig. 3 |. Sp1 mediates the stiffness-induced tumorigenic phenotype.
a, MEME-ChIP de novo motif analysis for differentially accessible regions between soft and stiff matrices. b, MEME-ChIP de novo motif analysis for regions of decreased accessibility in SAHA-treated cells in stiff matrices c, Sp1 motif logo (top) best matches the top ranked MEME-ChIP de novo motifs from soft vs. stiff comparison (middle) and from regions of decreased accessibility in SAHA-treated cells in stiff matrices. d, Transcription factor footprint of 200 bp region centered on Sp1 motifs in differentially accessible regions. Cartoon illustrating an accessible chromatin region displaying the Sp1 motif in stiff ECM that is inaccessible to Sp1 in soft ECM. e, Quantification of Sp1 phosphorylation levels at Thr453 for cells in stiff matrices and treated with PI3K inhibitor (LY294002) or class I HDAC (SAHA). All values are normalized by the value for soft matrices of the same treatment condition (mean ± S.D.). Significance was determined by one-way ANOVA followed by Dunnett’s multiple comparison correction. f, Heatmap of gene expression for Sp1 target genes associated with malignant neoplasm of breast (n = 3, two-way ANOVA with multiple comparison correction, FDR = 0.05, color scale represents log2 fold change, dot pattern indicates no significance, black box represents no data). g, Heatmap of gene expression for Sp1 target genes associated with malignant neoplasm of breast for stiff matrices with indicated inhibitors compared to vehicle control (n = 3, two-way ANOVA with multiple comparison correction, FDR = 0.05, color scale represents log2 fold change, dot pattern indicates no significance). h, Confocal immunofluorescence of Sp1-knockdown cells in stiff matrices (left, from 38 total images) and representative outlines of shSp1 clusters. i, Quantification of roundness for shSp1 clusters in stiff matrices vs. empty vector controls in soft and stiff matrices (n = 3, median ± 95% C.I.). j, Quantification of invasive clusters (n = 3, mean ± S.D.). k, Schematic timeline of small molecule inhibitor of Sp1 washout experiment. l, Quantification of roundness of cell clusters in soft or stiff matrices treated with mithramycin A or vehicle control for the indicated period of time (n = 3, median ± 95% C.I.). m, Quantification of invasive clusters (n = 3, mean ± S.D.). n, Confocal immunofluorescence of cells in soft or stiff matrices treated for the duration indicated and imaged after 14 total days (representative images from 15 images per group). Significance was determined by Kruskal-Wallis test followed by Dunn’s multiple testing correction for roundness and by one-way ANOVA followed by Dunnett’s multiple testing correction for invasion.

