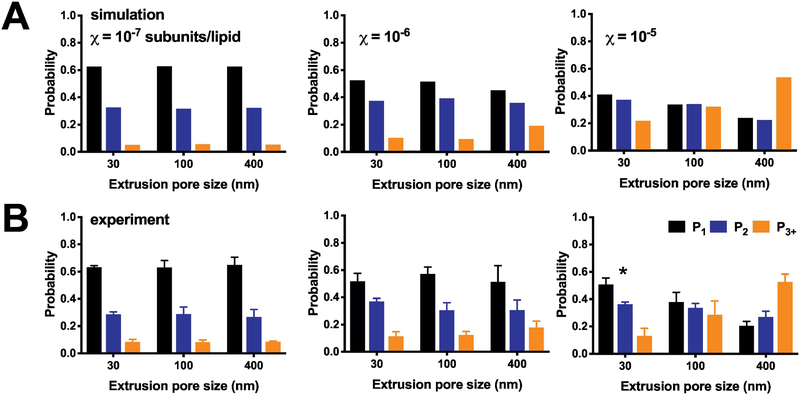
Figure 5. Photobleaching probability distributions as a function of liposome size.
(A) Simulations of the expected (P1, P2, P3+) photobleaching distribution at densities of χ = 10−7, 10−6 and 10−5 subunit/lipid, using the 2:1 POPE:POPG liposome size distributions presented in Figure Simulations parameters include fluorophore labeling yields Pfluor = 0.7 & Pns = 0.1, reconstitution yield = 1, monomer-dimer equilibrium KD = 1 × 10⁻⁸ subunits/lipids, and liposomes with r < 25 nm inaccessible to dimers. Note that the simulation densities used here correspond to the expected observed mole fraction densities, assuming a recovery yield = 0.5. (B) Experimental photobleaching distributions of ‘WT’ CLC-ec1-Cy5 in 2:1 POPE:POPG liposomes as a function of protein density and extrusion pore size. Data shown as mean ± sem, n = 3–4. Experimental data is statistically compared to the simulated distributions by the chi-square test showing no significant discrepancies, except the 30 nm extruded 10−5 experiment, which is significantly different with p < 0.0164.

