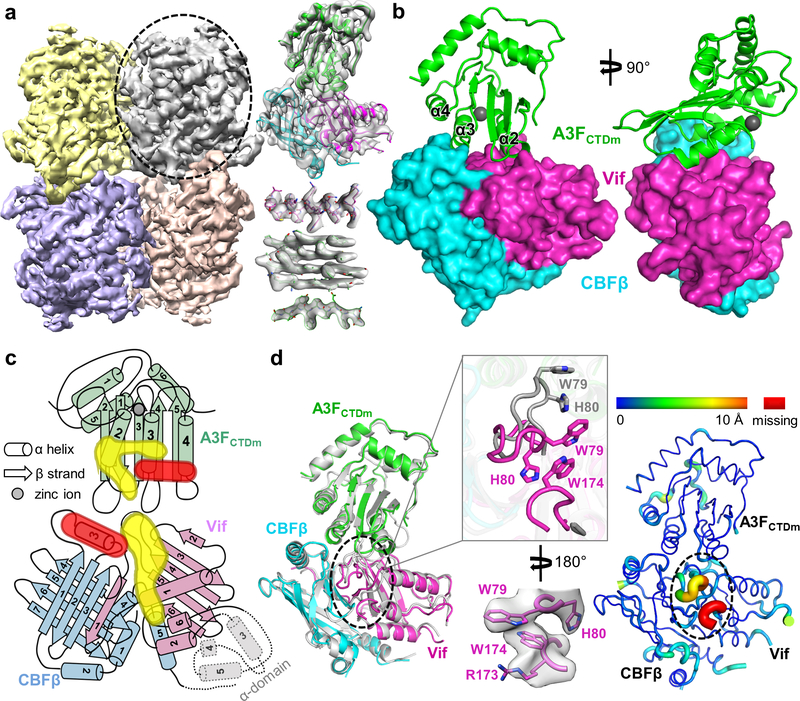
Fig. 1: Vif and CBFβ form a platform for interaction with A3F.
a, Left, 3D cryo-EM reconstruction of the Vif–CBFβ–A3FCTDm complex in the tetrameric state at 3.9 Å resolution, with each ternary complex protomer colored differently. Right, the cryo-EM map of one Vif–CBFβ–A3FCTDm ternary complex (oval on left) is shown on top, with examples of high-quality α helix and β sheet/strand regions at the bottom. b, Overall structure of one Vif–CBFβ–A3FCTDm ternary complex in two orthogonal views. Vif (magenta) and CBFβ (cyan) form a wedge-like platform for A3FCTDm (green) to dock primarily via one end of its α-helical surface, distal from the zinc-containing catalytic site (red sphere). c, Cartoon illustration of the A3FCTDm and Vif/CBFβ secondary structures, with the CBFβ-A3FCTDm interface highlighted in red and the Vif-A3FCTDm interface in yellow. The α helices are represented by cylinders, β strands by arrows, and the zinc ion by a circle. The deleted small α-domain (grey) of Vif and the corresponding interacting CBFβ C-terminus are contoured by dash lines. The detailed annotations of the secondary structure elements are illustrated in Extended Data Fig. 10. d, Majority of Vif–CBFβ and A3FCTDm maintain their conformations upon ternary complex formation. Left, superposition of the ternary structure with individual A3FCTD (PDB 3WUS, grey) and Vif–CBFβ portion from the Vif–E3 ligase structure (PDB 4N9F, grey). The major local conformational changes are circled, with details (top) and the observed cryo-EM map (bottom) shown in the middle inset. Right, the rainbow putty representation of the superposition. The color spectrum and the coil thickness represent the deviation of the aligned Cα atoms in the structures, which varies from 0 Å (blue) to ~10 Å (orange). The Vif C-terminal region residues 173–176 missing in the Vif-E3 ligase structure 23 are colored in red.

