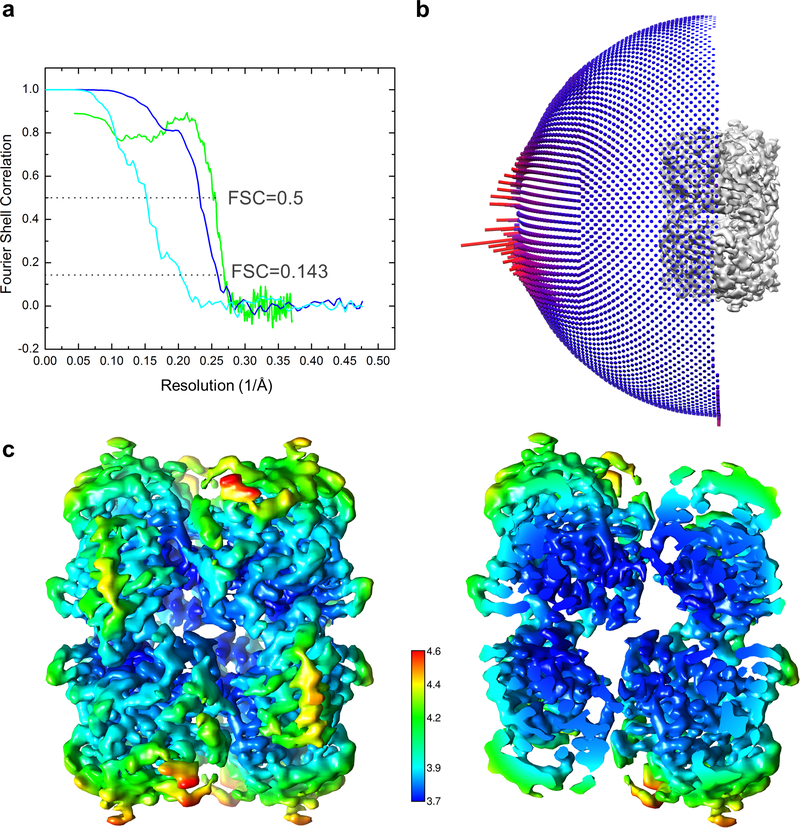
Extended Data Fig. 9. Parameters of the cryo-EM reconstructions of Vif–CBFβ–A3FCTDm complexes and the final model.
a, Fourier shell correlation (FSC) curves of the half maps from gold standard refinements of the Vif–CBFβ–A3FCTDm complex with (cyan) or without (blue) the Vif α-domain and the corresponding interacting CBFβ C-terminus. The FSC curve of the map and final model of the truncated Vif–CBFβ–A3FCTDm complex is in green. Resolution of the maps are determined by the cutoff values at FSC = 0.143. b, The Euler angle distribution of the classified particles of the truncated Vif–CBFβ–A3FCTDm complex used for the final 3D reconstruction. c, Color coded local resolution estimation of the D2 symmetrized map of the truncated Vif–CBFβ–A3FCTDm complex.

