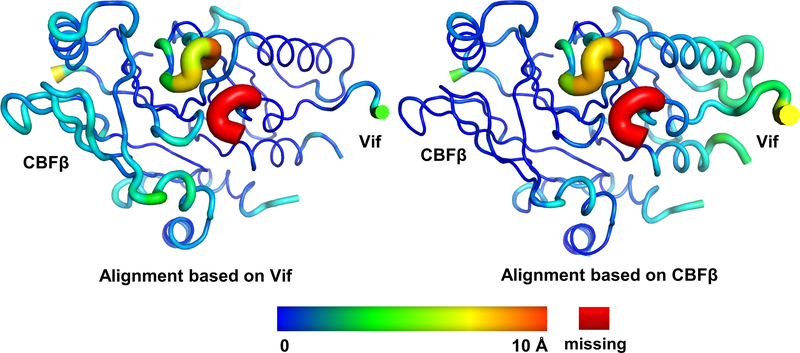
Extended Data Fig. 3. The relative conformational changes between Vif and CBFβ upon A3FCTDm binding, shown as rainbow putty representations of superpositions.
The color spectrum and the coil thickness represent the deviation of the aligned Cα atoms in the structures, which varies from 0 Å (blue) to ~10 Å (orange). The Vif C-terminal residues 173–176 missing in the Vif–E3 ligase structure are colored in red. The Vif–CBFβ structure without A3FCTDm binding used for superposition is extracted from the Vif–E3 ligase structure (PDB 4N9F).

