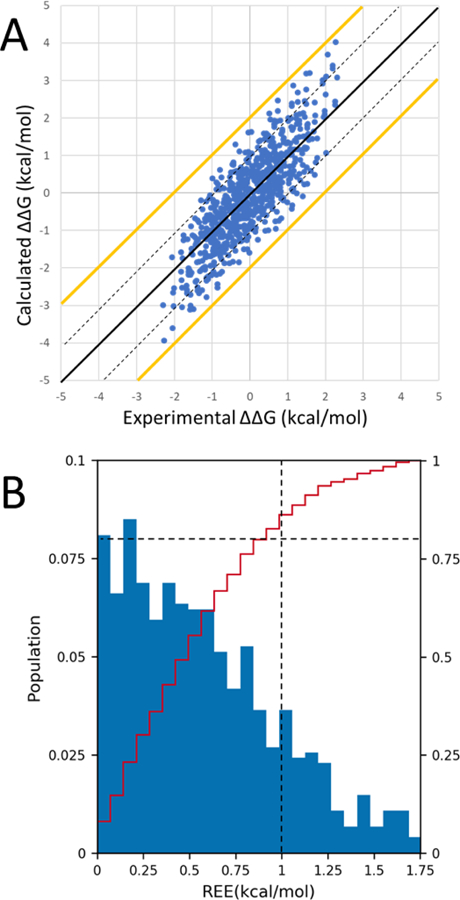
Figure 3.

A) ∆∆G values for all 741 (39X38/2) pairs of ligands in the dataset. The black line represents y=x. The yellow lines represent a +/−2.0 kcal/mol error from the experimental ∆∆G. The dashed black lines represent a +/−1.0 kcal/mol error from the experimental ∆∆G. The data points fit a line of equation y=1.12x-0.06. B) Histogram (blue bars) and cumulative histogram (red line) of relative energy errors (REE) between calculated and experimental ∆∆G values. The horizontal dashed line indicates a cumulative population of 80% and the vertical dashed line indicates an REE of 1 kcal/mol.
