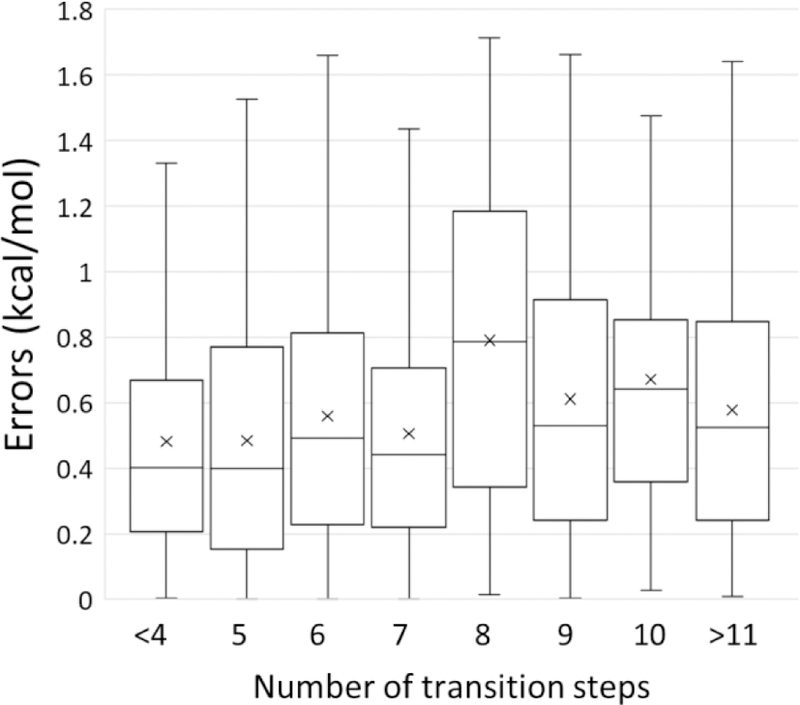
Figure 5.

Box and whisker plot of errors between calculated and experimental ∆∆G values versus the number of transition steps. Boxes indicate the second and third quantiles of the data. Whisker indicates the first and fourth quantiles of the data. The mean values of errors are shown as crosses. The median values are shown as horizontal lines in the box.
