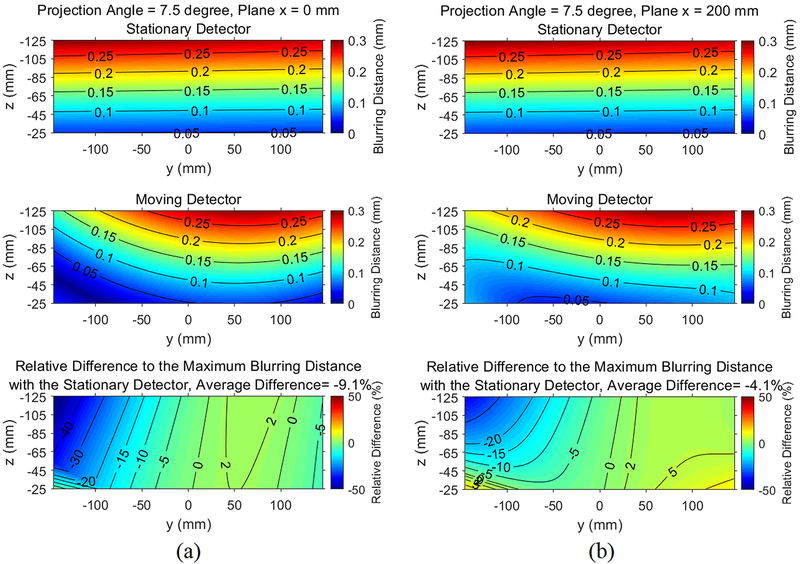
Figure 14.
Contour plots illustrating the spatial dependence of the blurring distance on a y-z plane for the maximum projection angle (θ = 7.5°) for (a) x = 0 (chest wall); (b) x = 200 mm. The third row shows the relative difference of the blurring distance between the moving detector and the stationary detector. A negative relative difference means that the moving detector reduces the blurring distance.

