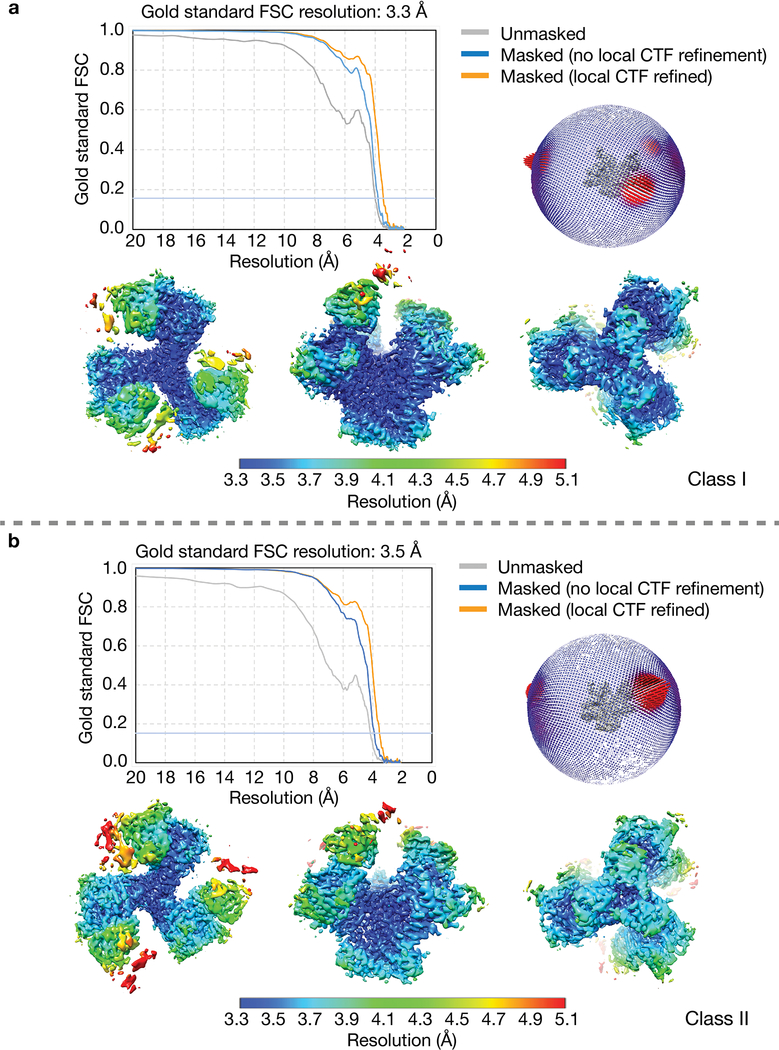
Extended Data Fig. 3. Validation of the BG505 SOSIP-sCD4-E51 complex structures.
Class I (panel a) and class II (panel b) E51-sCD4-BG505 complex structures. Top left in both panels: Gold-standard Fourier Shell Correlations (FSCs) of two classes of maps. Top right: Orientation distributions for class I and class II structures. Bottom: Local resolution estimations for class I and class II density maps (calculated using the local resolution program in RELION3,4).

