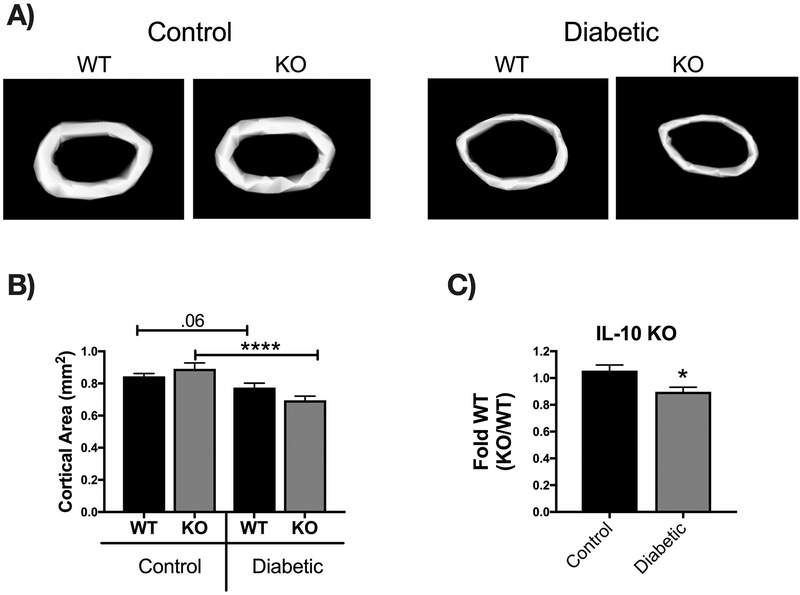
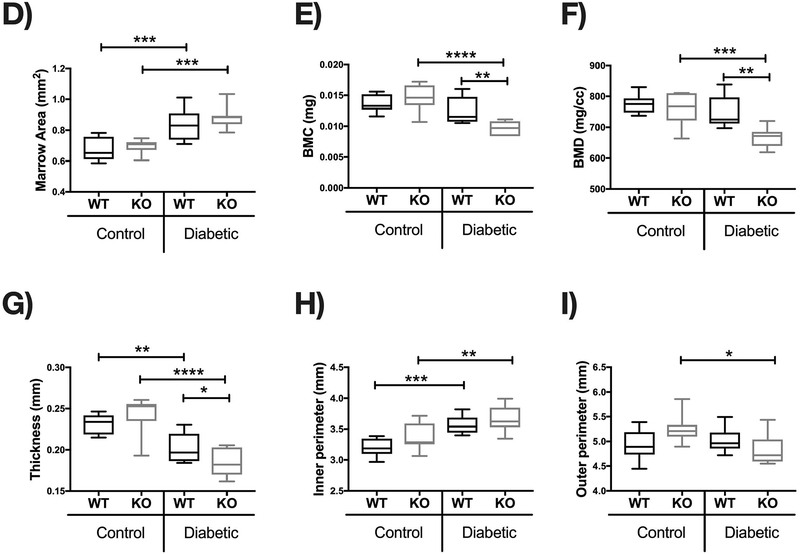
Figure 3. IL-10 deficiency exacerbates T1D-induced cortical bone loss 1 month after diabetes induction.
Cortical bone analysis were performed using μCT, on femoral bones described in Figure 2. (A) Representative micro-computed tomography isosurface images. (B) Cortical area (mm2). (C) Cortical area from the KO groups normalized to respective WT groups. * represent p<0.05 by T-test against WT diabetic group. (D) Marrow area (mm2). (E) Bone mineral content (mg). (F) Bone mineral density (mg/cc). (G) Cortical thickness (mm). (H) Inner perimeter (mm). (I) Outer perimeter. Bar graphs values are averages ± standard error; Whiskers in box plots represent 5–95 percentile values; n= 7–9 per group. *p<0.05, **p<0.01, ***p<0.001, ****p<0.0001. Statistical analysis performed by One-way ANOVA followed by Fisher’s LSD post-test. WT=wild type, KO= IL-10 knockout mice.


