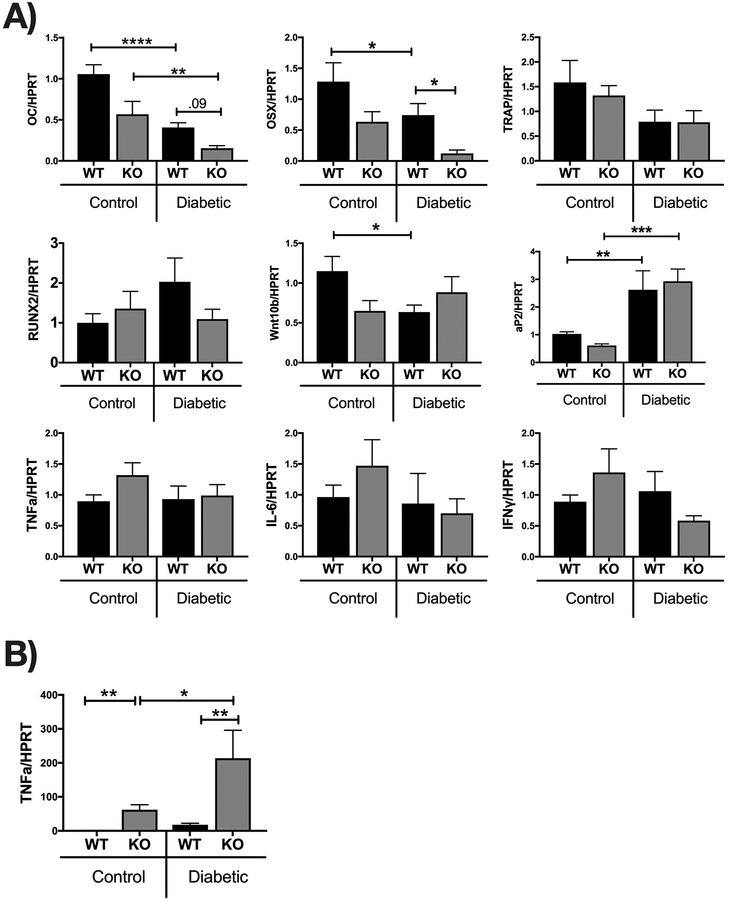
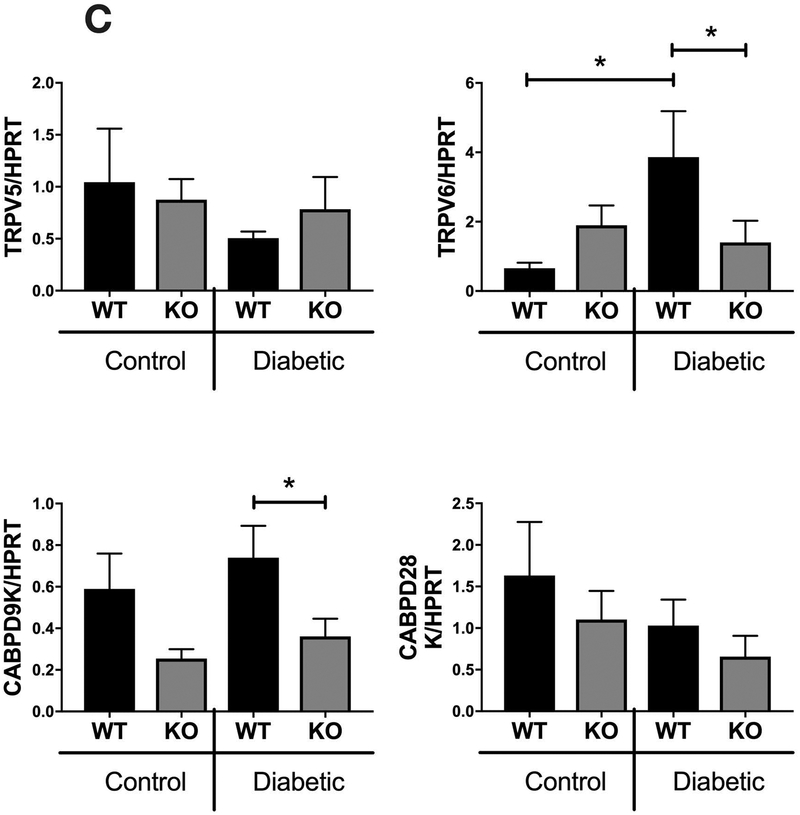
Figure 8. Relative gene expression in the tibia and intestine from WT and IL-10 knockout mice.
Control and STZ treated WT and IL-10 knockout mice were euthanized 4 weeks after the first STZ injection. Tibia (A), colon (B) and jejunum (C) were collected, RNA extracted and mRNA analysis of indicated genes assessed by Q-RT-PCR. Genes were normalized to HPRT. Values are averages ± standard error; n= 8–10 per group. *p<0.05, **p<0.01, ****p<0.0001. Statistical analysis performed by One-way ANOVA followed by Fisher’s LSD post-test. Outliers removed: OSX (1 outlier in the KO-C and WT-D),Wnt10b (1 outlier in the WT-D), RUNX2 (1 outlier in the WT-C and KO-D), TRAP (1 outlier in the WT-D), TNFA(1 outlier in the WT-C and WT-D), IL-6 (1 outlier in all of the groups), IFNY (1 outlier in the WT-C, WT-D, and KO-D), TNFA colon (2 outliers in the WT-control, 1 outlier in the KO-control).


