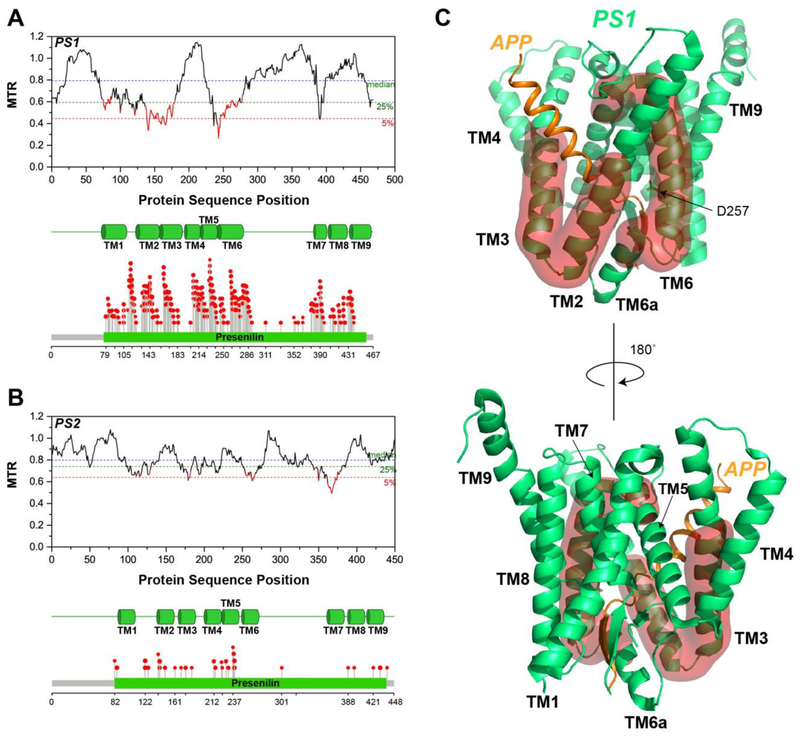
Figure 2. Segmental Intolerance Analysis of Presenilin.
(A) MTR plot for human presenilin 1 (PS1). The transmembrane (TM) domains of PS1 and the lollipop plot showing the locations of its familial Alzheimer’s disease missense variants are at the bottom of this panel. (B) MTR plot for presenilin 2 (PS2), along with the transmembrane domains and the lollipop plot for its familial Alzheimer’s disease mutations. (C) Mapping of the most intolerant segments of PS1 onto its cryo-EM structure (PDB: 6IYC) [32], as highlighted using a red surface representation.

