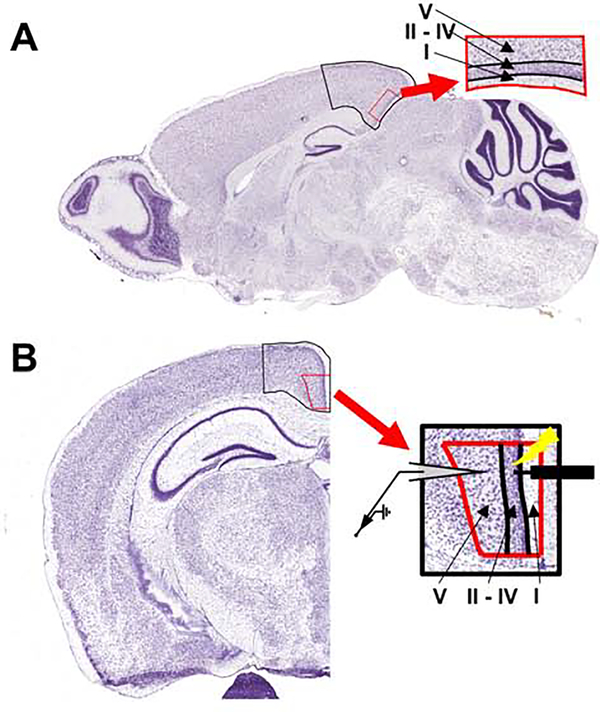
Figure 1. Atlas images outlining the location of the mouse retrosplenial cortex.
A) Representative parasagittal tissue section from an adult mouse with the retrosplenial cortex outlined in black. The enlarged red-outlined inset shows the different cortical layers. All immunohistochemistry experiments were performed using equivalent parasagittal tissue sections from mouse pups. B) Coronal tissue section from an adult mouse with the retrosplenial cortex outlined in black. The enlarged red-outlined inset shows the different cortical layers, as well as the placement of concentric bipolar stimulating (right) and recording (left) electrodes used for electrophysiology experiments in slices from mouse pups. Images adapted from the Allen Developing Mouse Brain Atlas (https://mouse.brain-map.org/static/atlas) (Lein et al., 2007). Image credit: Allen Institute.

