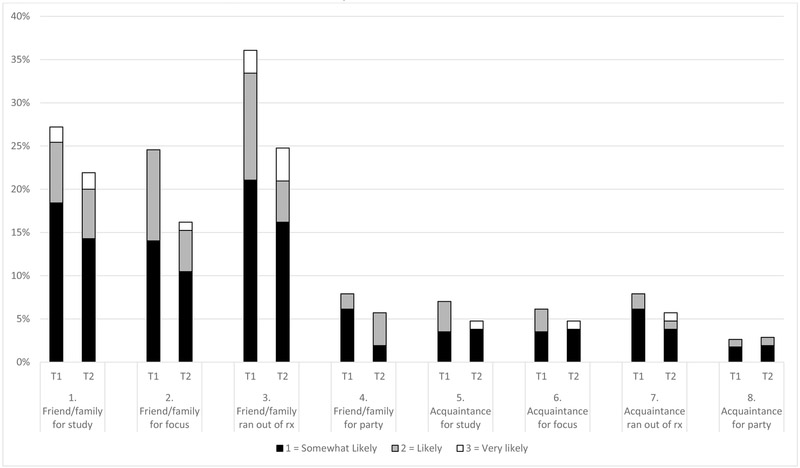
Figure 2. Likelihood of Diversion in Specific Situations by Time.
Note: T1 = Time 1 survey, n = 114; T2 = Time 2 survey, n = 105. Responses were rated on a 4-point scale ranging from 0 = Not at all likely to 3 = Very likely; 0 = Not at all likely not shown in figure for clarity. Although analyzed as a count of situations that the participant indicated any likelihood of diverting (score of 1 or higher), the full range of responses in the affirmative is displayed here for descriptive purposes.

