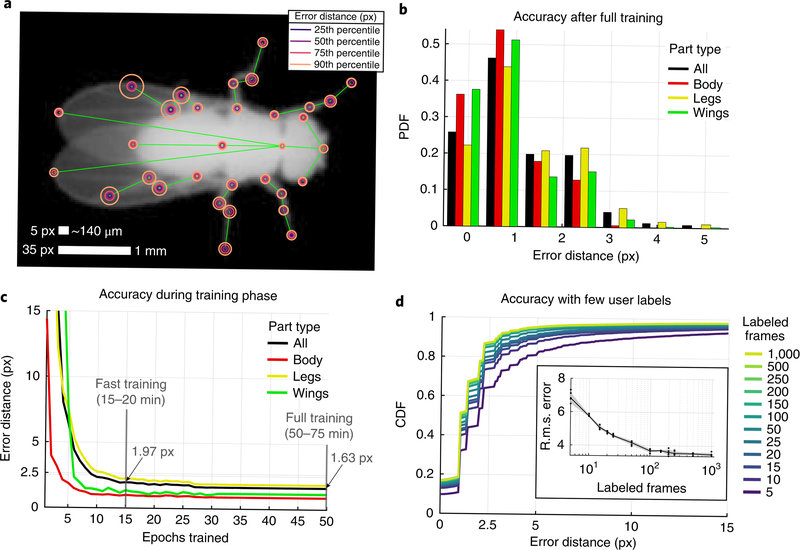
Fig. 2 |. LEAP is accurate and requires little training or labeled data.
a, Part-wise accuracy distribution after full training. Circles are plotted on a reference image to indicate the fraction of held-out testing data (168 images from seven held-out flies) for which estimated positions of the particular body part are closer to the ground truth than the radii. Scale bars indicate image and physical size; 35 px is equivalent to 1 mm at this resolution. b, Accuracy summary on held-out test set after full training. PDF, probability density function. c, Accuracy as a function of training time. In the ‘fast training’ regime, n = 1,215 labeled frames were used for training. Lines and shaded area (smaller than line width) indicate the mean and s.e.m. for all held-out test images pooled over five runs. Run time estimates based on high-end consumer or enterprise GPUs. d, Accuracy as a function of the number of training examples. Distributions indicate estimation errors in a held-out test set (n = 168 frames) with varying numbers of labeled images used for training, pooled over five ‘fast training’ runs. CDF, cumulative distribution function. Inset: median overall r.m.s. error over these five replicates at each sample size.

