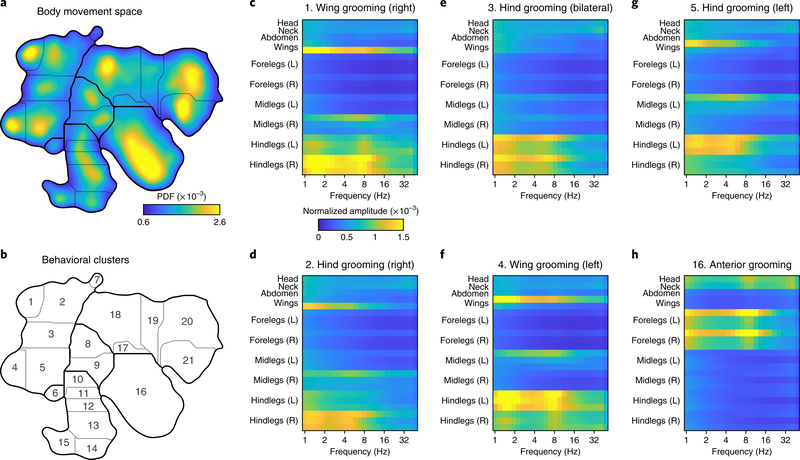
Fig. 4 |. Unsupervised embedding of body position dynamics.
a, Density of freely moving fly body-part trajectories, after projection of their spectrograms into two dimensions via unsupervised nonlinear manifold embedding11. The distribution shown was generated from 21.1 million frames. Regions in the space with higher density correspond to stereotyped movement patterns, whereas low-density regions form natural divisions between distinct dynamics. A watershed algorithm was used to separate the peaks in the probability distribution (Methods). b, Cluster boundaries from a with cluster numbers indicated. c–h, Average spectrograms for the indicated body parts from time points that fall within the dominant grooming clusters; cluster numbers are indicated in b. Qualitative labels for each cluster based on visual inspection are provided for convenience. Color map corresponds to normalized power for each body part.

