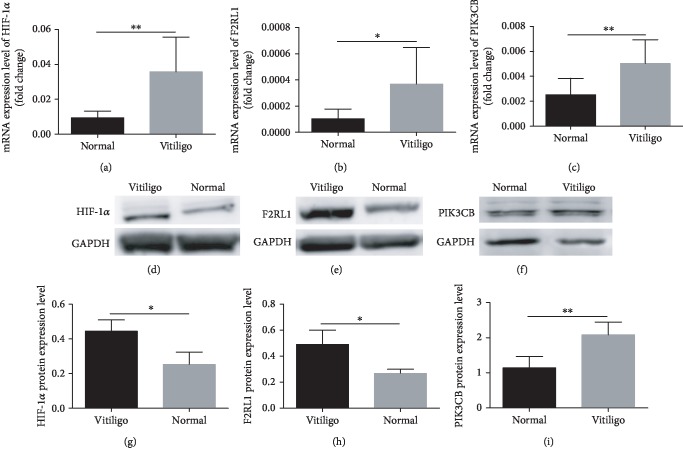
Figure 3.
Validation of DEGs by RT-qPCR and western blotting. Among 3 identified genes, the mRNA expression levels of HIF-1α (p < 0.01) (a), F2RL1 (p < 0.05) (b), and PIK3CB (p < 0.01) (c) were elevated in CD8+ T cells from PBMCs of vitiligo patients (n = 8) compared to normal control (n = 8). (d–f) HIF-1α (p < 0.05) (n = 3), F2RL1 (p < 0.05) (n = 3), and PIK3CB (p < 0.01) (n = 4) were increased in CD8+ T cells from PBMCs of vitiligo patients compared to normal control. (g–i) Statistical analysis of HIF-1α, F2RL1, and PIK3CB was performed between vitiligo patients and normal control. Data are shown as mean ± SEM. ∗p < 0.05; ∗∗p < 0.01.

