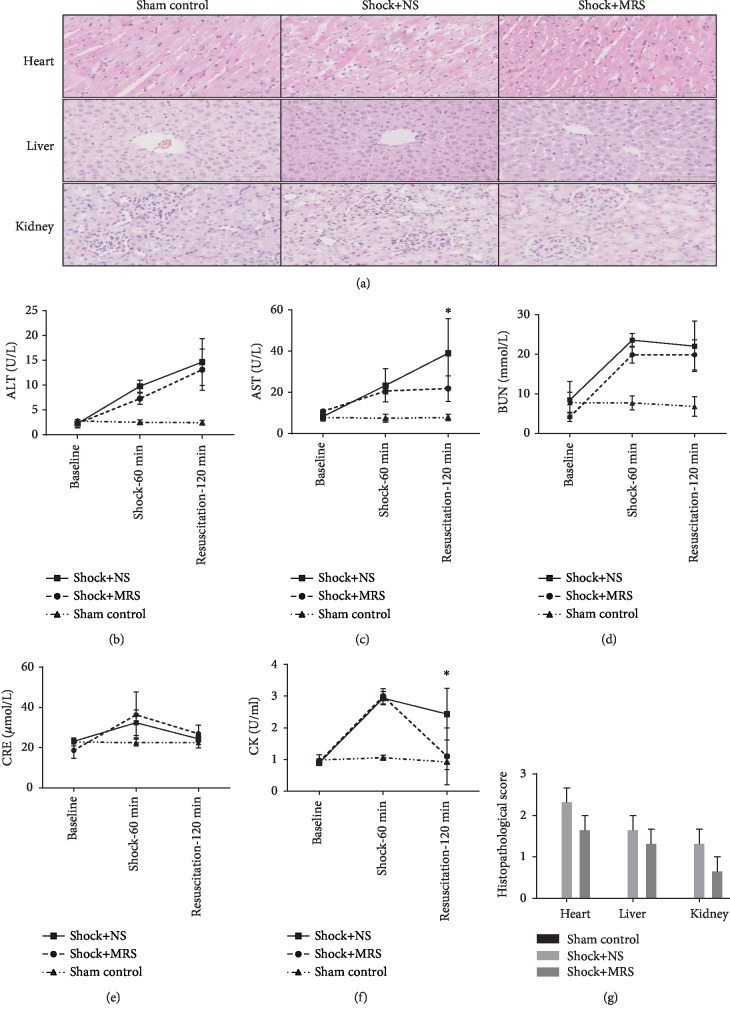
Figure 2.
Representative histology photomicrographs and organ function. (a) H&E staining was performed on liver, kidney, and cardiac tissue sections. Representative sections; original magnification, 200x. (b) Serum alanine aminotransferase activity. (c) Serum aspartate aminotransferase activity. (d) Serum blood urea nitrogen level. (e) Serum creatinine level. (f) Serum creatine kinase activity. (g) Histopathological score. ∗P < 0.05 Shock+NS group versus Shock+MRS group.

