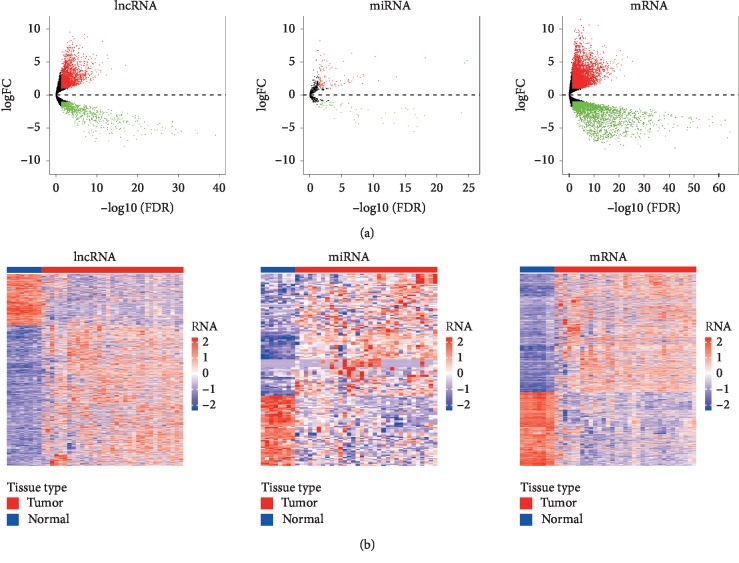
Figure 1.
(a) Volcano plots showing the differential expression of lncRNAs, miRNAs, and mRNAs between intrahepatic cholangiocarcinoma (ICC) and adjacent normal tissues (|log 2FoldChange| > 2.0 and adjusted P value (FDR) < 0.01). The x-axis represents log2 transformed false discovery rate (FDR) values plotted in −log10, and the y-axis depicts the value of log2 transformed fold change in gene expression. Red dots represent upregulation while green dots represent downregulation. (b) Heatmaps of the differential expressed lncRNAs, miRNAs, and mRNAs between ICC and adjacent normal samples. Differential expressed genes are represented in rows, and samples are represented in columns. The expression value for each row was normalized by the z-score. Red stripes indicate high expression and blue stripes indicate low expression of genes. Blue bar represents normal samples, while red one represents samples.

