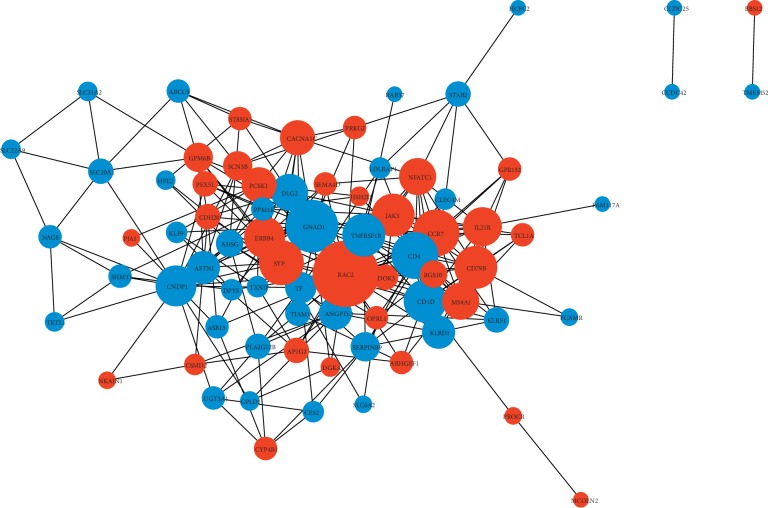
Figure 4.
Protein-protein interaction (PPI) network of hub genes of ceRNA in ICC. PPI data obtained from the online database STRING v11 and PPI network was constructed with scores of >0.4. The gray line indicates the interaction of the mRNAs. Red represents high expression and blue represents low expression. The size of the circle represents the degree of connection. The larger circles are hub genes in the network.

