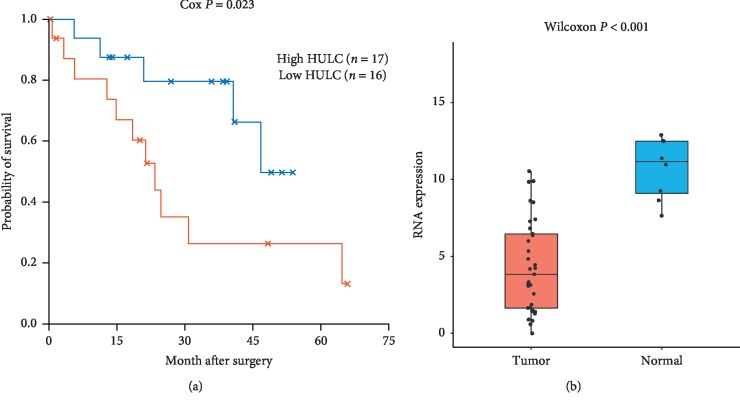
Figure 5.
(a) Kaplan–Meier survival curves for a DElncRNA associated with the overall survival (OS) in ICC patients. Cox P value was used to assess the survival differences between the two groups. (b) Box-plot for the RNA expression of lncRNA (HULC) between ICC and normal tissues. The y-axis represents the relative gene expressions (TMM normalized and log 2(x+1) transformed) and the x-axis represents the tumor or normal tissues.

