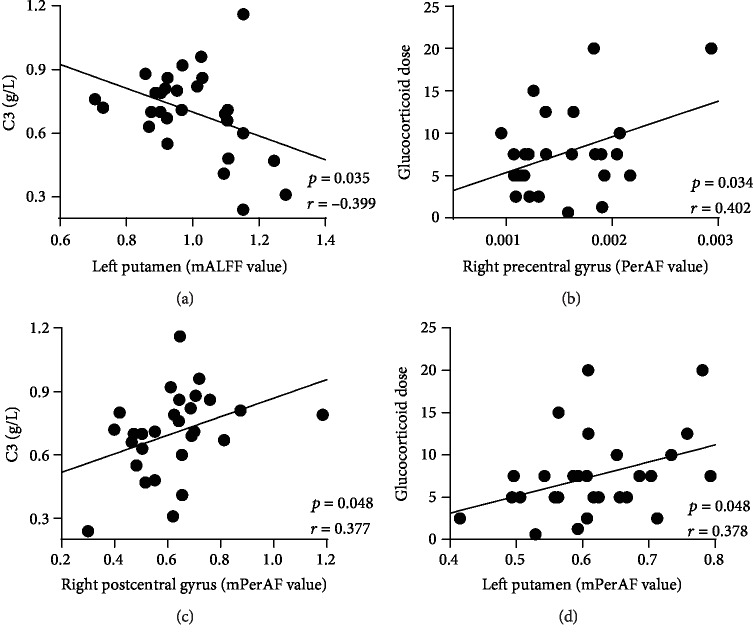
Figure 4.
The mALFF of the left putamen was negatively correlated with C3 (a) (r = −0.399, p = 0.035). Correlation analyses showed significantly positive correlation between the PerAF in the right precentral gyrus with glucocorticoid dose (b) (r = 0.402, p = 0.034), the mPerAF in the right postcentral gyrus and C3 (c) (r = 0.377, p = 0.048), and the mPerAF in the left putamen and glucocorticoid dose (d) (r = 0.378, p = 0.048).

