
Figure 4.
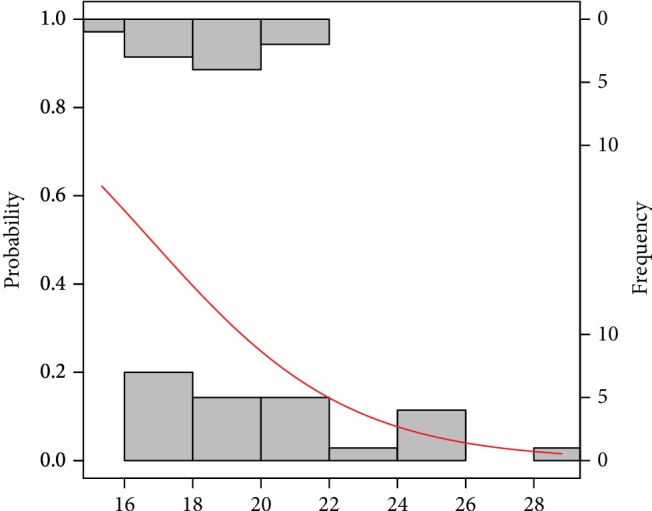
Probability model of pregnancy success by GR. Statistical interpretation: the modelled probability (y-axis) curve of the pregnancy (red line) decreases rapidly with the concentration of GR (x-axis) reaching no more than 50% chance of pregnancy over 17 units.