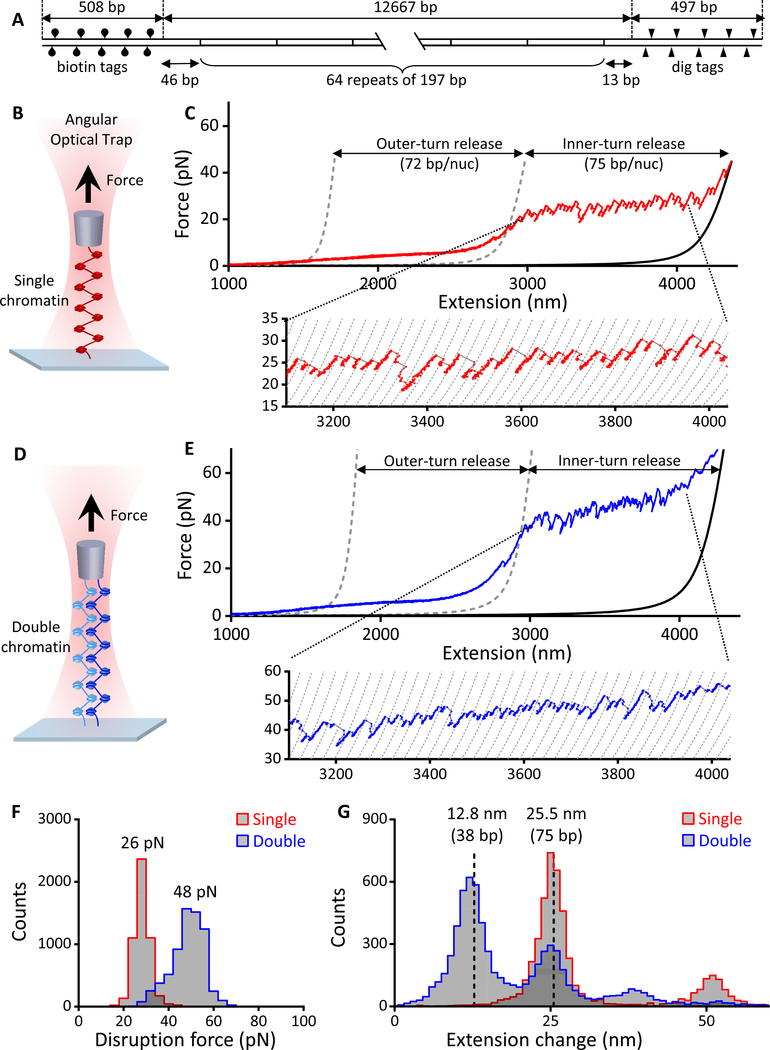
Figure 2. Stretching single and double chromatin fiber arrays.
(A) DNA template design. For details, see the “DNA Template Construction” section under Method Details.
(B) Experimental configuration to stretch a single chromatin fiber along the axial direction of the AOT to disrupt nucleosomes.
(C) An example trace of the force-extension curve of a single chromatin fiber containing ~ 53 nucleosomes, showing ~ 72 bp of smooth outer-turn DNA release and ~ 75 bp of sudden inner-turn release from each nucleosome. Outer-turn DNA release starts at ~ 2 pN and ends at ~ 15 pN, before the inner-turn DNA release starts, similar to what we have reported previously (Brower-Toland et al., 2005; Brower-Toland et al., 2002). The two gray dashed curves (Wang et al., 1997) correspond to naked DNA of lengths such that their force-extension curves cross the chromatin fiber curve at 2 pN and 15 pN and are used to characterize the amount of outer-turn DNA released. The black solid curve corresponds to a naked DNA whose number of base-pairs is the same as that of the chromatin fiber’s DNA (12,667 bp). The dashed curves of the inset are naked DNA curves with 75 bp increments in length.
(D) Experimental configuration to stretch a double chromatin fiber along the axial direction of the AOT to disrupt nucleosomes.
(E) An example trace of the resulting force-extension curve of a double chromatin fiber, each containing ~ 47 nucleosomes. The two gray dashed curves (Wang et al., 1997) are theoretical curves of two parallel naked DNA molecules of lengths such that they cross the chromatin fiber curves at 4 pN and 30 pN and are used to characterize the amount of outer-turn DNA released. The black solid curve is a theoretical force-extension curve of two parallel naked DNA molecules, each of 12,667 bp, the same as the DNA template length of the chromatin fiber. The dashed curves of the inset are naked DNA curves of two parallel molecules with 75 bp increments in length.
(F) The distributions of inner-turn disruption force for single and double chromatin fiber substrates. The peak values of these distributions are indicated.
(G) The distributions of extension change from inner-turn disruptions for single and double chromatin fiber substrates. Extension change at a disruption event was defined as the change in the DNA contour length and expressed either in units of nm or bp. The two dashed lines are located at 25.5 nm (or 75 bp) and half of this value.
See also Figures S3 and S4.

