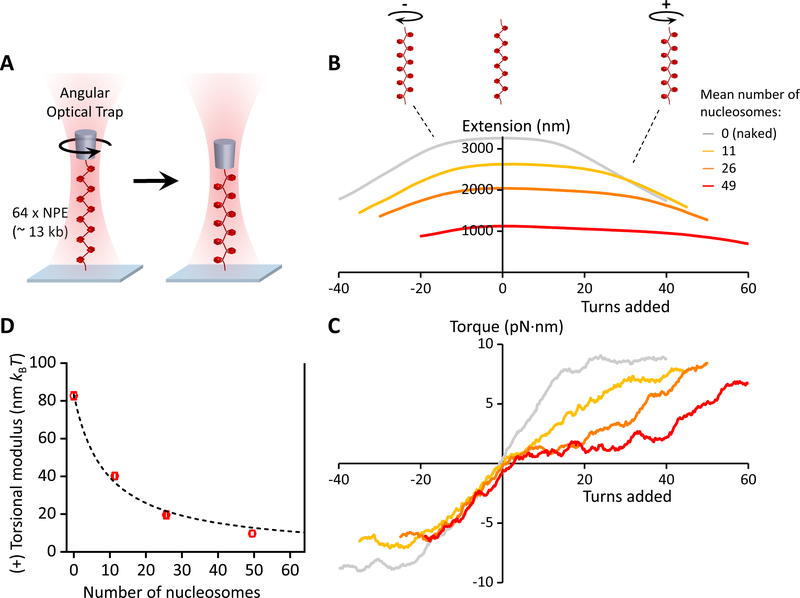
Figure 3. Torsional measurements of a single chromatin fiber.
(A) Experimental configuration. One end of a chromatin fiber was torsionally constrained to the surface of a microscope coverslip while the other end was torsionally constrained to the bottom of a nanofabricated quartz cylinder that was held in the angular optical trap (AOT) (Figure S2). The chromatin fiber was then placed under a constant force of 0.5 pN and twisted in both the (+) and (−) directions. At the end of this torsional measurement, the nucleosome quality and saturation level of each chromatin fiber were assayed by returning the fiber to the zero-turns state and stretching it axially to disrupt the nucleosomes (Figures 2B and 2C; Figures S3A–S3C; Quantification and Statistical Analysis). The fiber stability was assayed from the twisting data (Figures S3D and S3E).
(B & C) The measured extension and torque versus turns added, under different levels of nucleosome array saturation, indicated by the mean number of nucleosomes on the substrate (N ~ 35 traces for each curve). Extension and torque signals were smoothed by sliding windows of 1 turn and 4 turns respectively. For naked DNA, torque increases until DNA buckles to form a plectoneme, then torque plateaus. For chromatin fibers, the data suggest that an analogous structural transition may be occurring. The (+) torsional stiffness of each curve in (C) was determined from a linear fit (not shown) to the initial (pre-”buckling”) slope upon adding (+) turns.
(D) The measured torsional modulus as a function of the number of nucleosomes in the substrate. kBT is the thermal energy. Error bars were converted from the uncertainties in the slopes of the linear fits in (C). The dashed curve is a fit by a simple model, yielding a modulus of 10.2 nm kBT for a chromatin fiber with all 64 NPEs occupied (Quantification and Statistical Analysis). The solid vertical line at 64 indicates the number of NPEs on the template.

