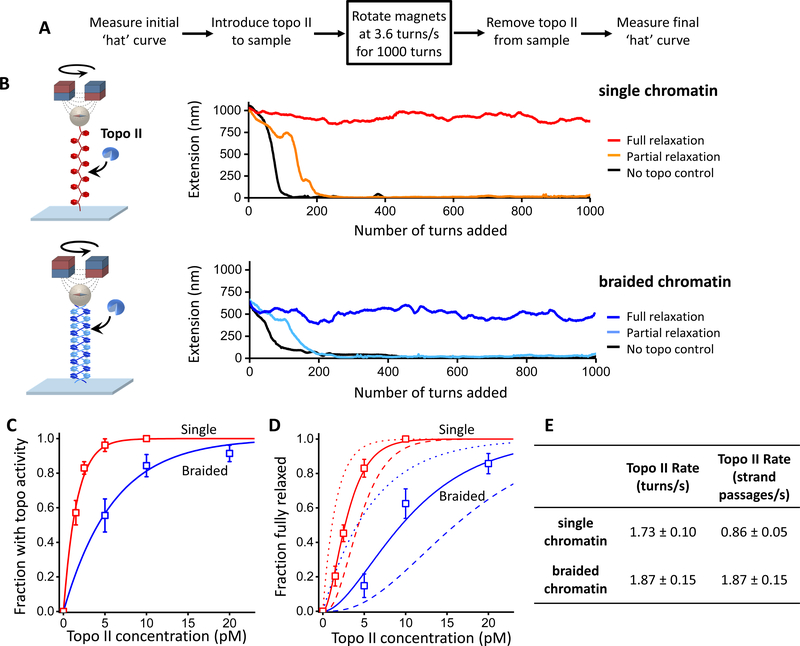
Figure 6. Topo II relaxation of single and braided chromatin fiber substrates.
Experiments were carried out using a magnetic tweezers (MT) setup with chromatin fibers each containing ~ 50 nucleosomes on average. The MT allowed supercoiling to be monitored via an extension change for multiple molecules simultaneously.
(A) Experimental scheme. Highlighted is the key step where the pair of magnets was rotated at a constant rate. The initial and final ‘hat’ (i.e., extension versus turns) curves were used to determine the saturation, stability, and geometry of arrays (Figure S6; Quantification and Statistical Analysis).
(B) Example traces of single and braided chromatin fiber substrates during the key step. A trace is defined as being fully relaxed if the mean rate of topo II relaxation is within 5% of the magnet rotation rate during the course of the key step.
(C) Fractions of traces that showed any topo II activity as a function of the concentration of topo II dimers introduced into the sample chamber. Topo II action on a substrate is assumed to follow a Poisson distribution, and thus the fraction with activity depends on topo concentration according to: with Kactive being the topo II concentration at which there is an average of one topo II molecule relaxing the substrate. Thus provides a measure of topo II’s preference for a substrate. The fits yielded Kactive = 1.6 ± 0.2 and 6.0 ± 1.0 pM (mean ± s.e.m.) for the single and braided fiber substrates, respectively.
(D) Fractions of traces that remained fully relaxed as a function of the concentration of topo II dimers introduced into the sample chamber. The Poisson distribution model predicts that the fraction of traces fully relaxed is given by: where nc is the minimum number of topo II molecules required to keep up with the rotation and Kactive was determined in (C). We found that nc = 2.1 ± 0.1 (mean ± s.e.m.) for the single substrate and 1.9 ± 0.2 for the braided substrate.
(E) Relaxation rate of a single topo II molecule on single and braided chromatin fiber substrates. From the magnet rotation rate (3.6 turns/s) and the minimum number of topoisomerase molecules required to keep up with this rotation nc obtained above, the relaxation rate for an individual topo II molecule acting on each substrate in units of turns/s was determined. Given that one strand passage event removes two self-crossings in a single substrate but one intermolecular crossing in a braided substrate (Bates and Maxwell, 2005; Vologodskii, 2007), the relaxation rates were converted to units of strand passages/s. The errors in the calculated rate were determined by considering contributions from different nc values (nc = 1, …,4) to the measured fractions.

