
Figure 1.
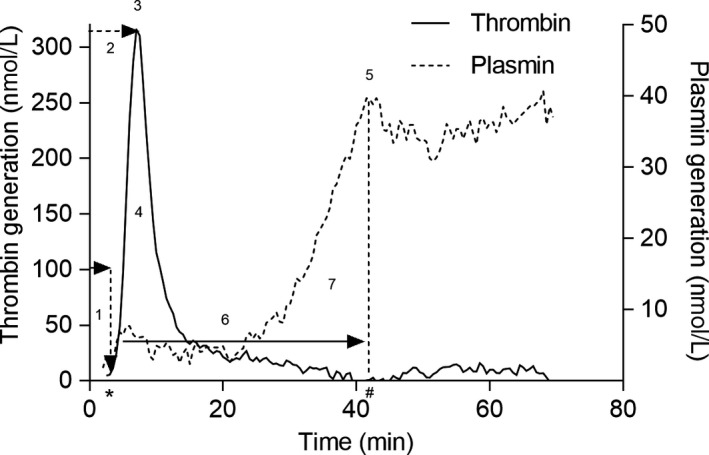
The Nijmegen Hemostasis Assay. (1) lag time, the time at which thrombin formation is initiated; (2) thrombin peak time, that is the time when thrombin production reaches maximal velocity; (3) thrombin peak height, the maximal velocity of thrombin generation; (4) the area under the curve (AUC, relates to the thrombin potential); 5) plasmin peak height, the maximal velocity of plasmin production and; (6) fibrin lysis time (FLT), the time between the initiation of thrombin generation and the time plasmin generation reaches maximal velocity; (7) plasmin potential, area under the curve that represents the total amount of plasmin generated