Figure 1.

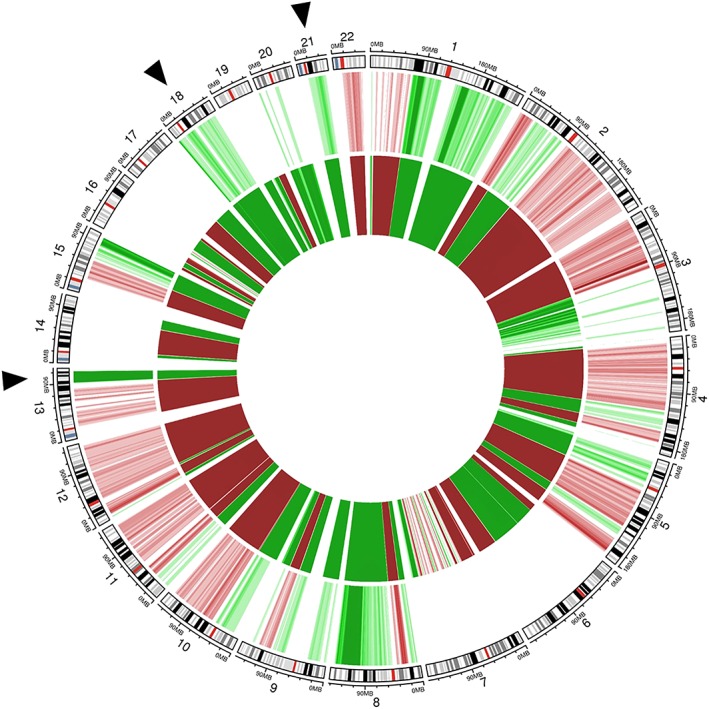
Circos plot showing chromosomal anomalies detectable in plasma cell‐free (cfDNA) and tumor DNA of a pregnant women being 8 weeks pregnant and with a known breast cancer diagnosis. The genomic representation profile of the autosomal chromosomes is shown in clockwise order, aligned with chromosomal ideograms (outer circle). Chromosomal anomalies with a chromosomal z‐score ≥ 3 (suggesting gain) are indicated in green; those with a z‐score ≤ −3 (suggesting loss) are shown in red. Color grades are used to indicate four z‐score intervals of length 1.5 ranging from 3 (−3) to 9 (−9). The fifth darkest color is reserved for values greater than 9 or less than −9. The middle circle depicts the genome‐wide NIPT profile in plasma cfDNA with elevated z‐scores for chromosomes 21, 18, and 13 (indicated by black arrows). Upon a genome‐wide view, (sub)chromosomal imbalances across multiple autosomal chromosomes can be observed. The inner circle shows the copy number profile of matched tumor DNA extracted from formalin‐fixed paraffin‐embedded tumor biopsy material (whole‐genome low‐pass sequencing, 0,1 × coverage). Comparison of both profiles reveals that the (sub)chromosomal CNAs and aneuploidies observed in plasma cfDNA are derived from tumor DNA. Details about the NIPT data analysis pipeline can be found elsewhere 11. [Colour figure can be viewed at http://wileyonlinelibrary.com]
