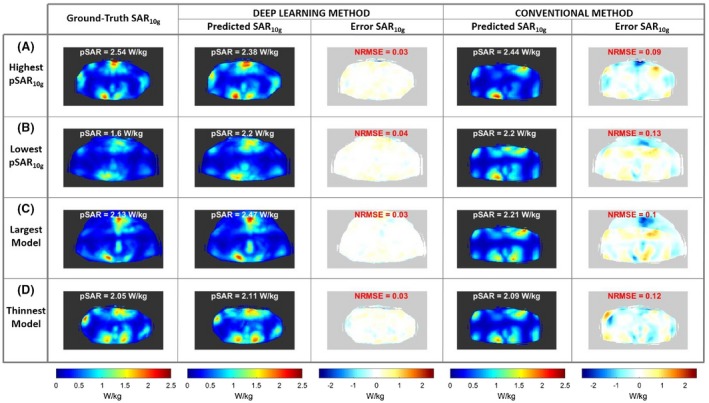
Figure 3.

Transverse maximum intensity projection (MIP) of the ground‐truth SAR10g distributions, the predicted SAR10g distributions, and error SAR10g distributions using the deep learning method and the predicted SAR10g distributions and error SAR10g distributions using the generic model Duke (conventional method). All results are with transmit phases optimized for prostate imaging. A, Model with the highest prostate‐shimmed peak local SAR (pSAR10g) value. B, Model with the lowest prostate‐shimmed pSAR10g value. C, Largest model with body mass index (BMI) 28 kg/m2. D, Thinnest model with BMI 21.6 kg/m2. Abbreviation: NRMSE, normalized RMS error
