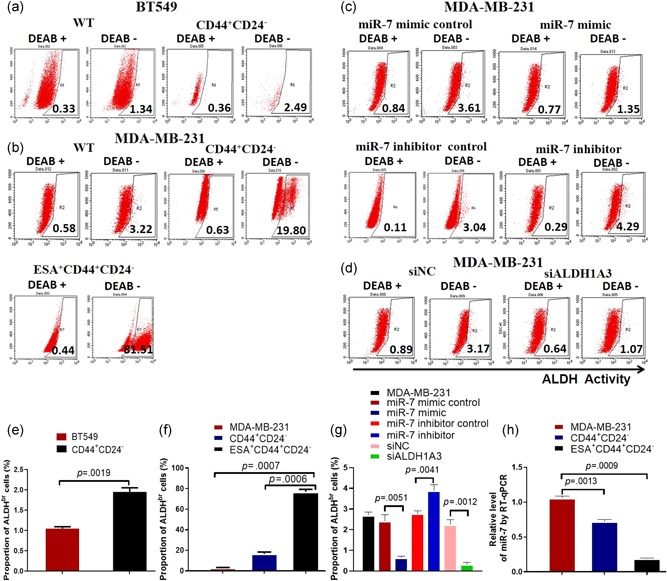
Figure 1.

Detecting expressions of ALDH and miR‐7. FCM analysis of ALDH positive cells. (a) ALDH1 positive cells in BT549 cell line and CD44+CD24−BCSCs isolated from the BT549 cell line. (b) ALDH1A3 positive cells in MDA‐MB‐231 cell line and CD44+CD24− or CD44+CD24−ESA+BCSCs isolated from the MDA‐MB‐231 cell line. (c) ALDH positive cells in the MDA‐MB‐231 cells transiently transfected with miR‐7 mimic or different controls. (d) ALDH1 positive cells in MDA‐MB‐231 cells transiently transfected with siALDH1A3 or ALDH1A3 negative control (siNC). (e) ALDH positive cell proportion in BT549 cells and CD44+CD24−BCSCs analyzed by FCM. (f) ALDH positive cell proportion in MDA‐MB‐231 cells, CD44+CD24−, and CD44+CD24− ESA+BCSCs analyzed by FCM. (g) ALDH positive cell proportion in MDA‐MB‐231 cells transfected with miR‐7 mimic and different controls or siALDH1A3 and siNC analyzed by FCM. (h) RT‐qPCR analysis exhibits the relative level of miR‐7 in MDA‐MB‐231 cells, CD44+CD24−, and CD44+CD24−ESA+BCSCs, respectively. ALDH, aldehyde dehydrogenase; BCSC, breast cancer stem cell; ESA, epithelium specific antigen; FCM, flow cytometry; miR, microRNA; RT‐qPCR, reverse transcription quantitative real‐time polymerase chain reaction; WT, wild type [Color figure can be viewed at wileyonlinelibrary.com]
