
Figure 2.
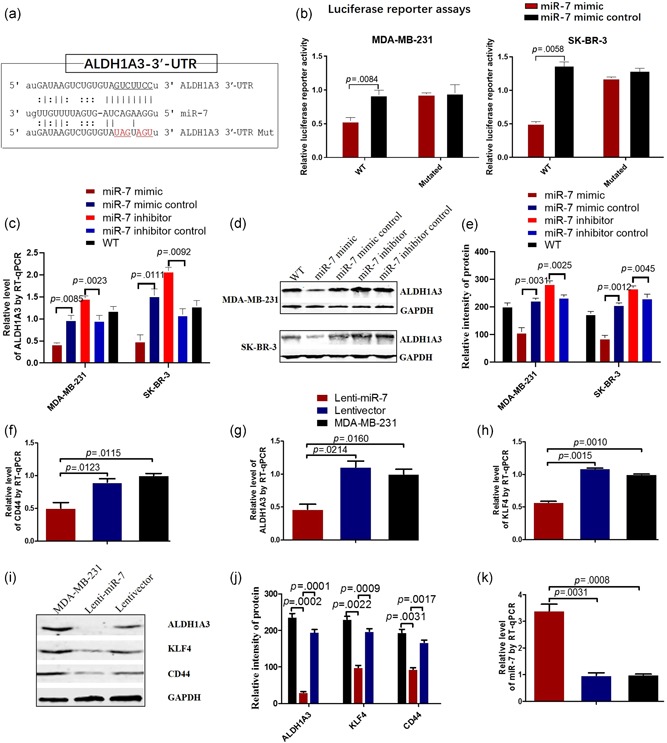
MiR‐7 reduces the ALDH1A3 activity and the stem‐like molecular expression. (a) Putative miR‐7 binding and mutated sites in ALDH1A3. (b) Luciferase reporter assay using vectors encoding putative binding sites. MDA‐MB‐231 and SK‐BR‐3 cells were transiently transfected with miRNA precursor or negative control, followed by transient transfection with basic vector or wild‐type reporter plasmids or mutated plasmids for 48 hr. Reporter activity was measured by luciferase assay. Data are presented as the mean ± SD. (c) RT‐qPCR analysis indicates the relative level of ALDH1A3 in MDA‐MB‐231 and SK‐BR‐3 cells transiently transfected with miR‐7 mimic or different controls. (d) ALDH1A3 expression in MDA‐MB‐231 and SK‐BR‐3 cells transfected with miR‐7 mimic or different controls analyzed by western blot. (e) Semi‐quantification analysis of western blot results of ALDH1A3 expression, referring to the differences as indicated. (f–h) RT‐qPCR analysis of the stem‐like molecular expressions of CD44, ALDH1A3, and KLF4 in MDA‐MB‐231 cells transfected with miR‐7 mimic or controls. (i) The expressions of CD44, ALDH1A3, and KLF4 in MDA‐MB‐231 cells transfected with miR‐7 mimic or controls analyzed by western blot. (j) Semi‐quantitative analysis of western blot results, referring to the differences as indicated. (k) RT‐qPCR analysis exhibits the miR‐7 expression in MDA‐MB‐231 cells transfected with miR‐7 mimic or miR‐7 negative control or without transfection. ALDH, aldehyde dehydrogenase; KLF, Kruppel‐like factor; miR, microRNA; RT‐qPCR, reverse transcription quantitative real‐time polymerase chain reaction; SD, standard deviation; WT, wild type [Color figure can be viewed at wileyonlinelibrary.com]