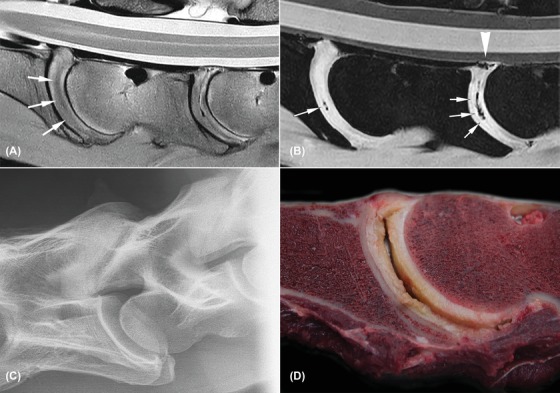
Figure 3.

Severely degenerated C5‐C6 and C6‐C7 intervertebral discs with cleft formation (horse 7). All images are oriented with cranial to the left side of the image and dorsal to the topside of the image. A, Sagittal proton density weighted image; diffuse hypointense areas are noted throughout the intervertebral discs with loss of definition of the nucleus (white arrows); B, sagittal water selective cartilage image; signal voids are noted in the clefts (white arrows) and dorsal aspect at the dorsal longitudinal ligament of C6‐C7 (white arrow head); C, radiograph of C6‐C7 depicts moderate degenerative joint disease but no changes at the intervertebral disc space; D, macroscopic image of C6‐7 with a large cleft centrally, fibrillation, and yellow discoloration. The dorsal longitudinal ligament tear is not visible in this image
