
Figure 6.
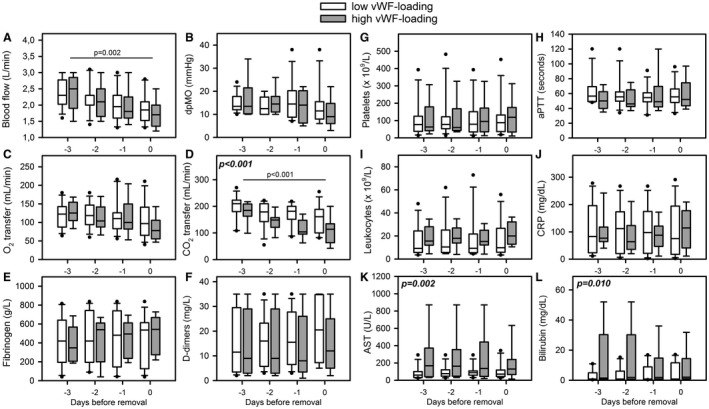
Time period of ECMO and laboratory data before oxygenator removal. Specific data from patients of the low vWF‐loading (n = 12, white boxes) and the high vWF‐loading (n = 9, gray boxes) were presented as median (IQR). Data included A, blood flow; B, pressure drop across the MO (dpMO); C, oxygen transfer (O2 transfer); D, carbon dioxide transfer (CO2 transfer); E, fibrinogen; F, D‐dimer levels; G, platelet counts; H, activated partial thromboplastin time (aPTT); I, leukocyte count; J, C‐reactive protein (CRP); K, aspartate transferase (AST); and L, bilirubin. Statistics comparing differences between low and high vWF‐loading groups were presented in bold and cursive letters. Time dependent decreases of blood flow and CO2 transfer were presented with a line