Figure 2.

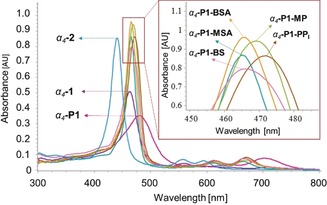
Overlay of the UV/Vis spectra (5.56×10⁻⁶ m) of α4‐1, α4‐P1, α4‐2, and complex systems (α4‐P1‐MSA, α4‐P1‐BSA, α4‐P1‐BS, α4‐P1‐PPi, α4‐P1‐MP) in CHCl3.

Overlay of the UV/Vis spectra (5.56×10⁻⁶ m) of α4‐1, α4‐P1, α4‐2, and complex systems (α4‐P1‐MSA, α4‐P1‐BSA, α4‐P1‐BS, α4‐P1‐PPi, α4‐P1‐MP) in CHCl3.