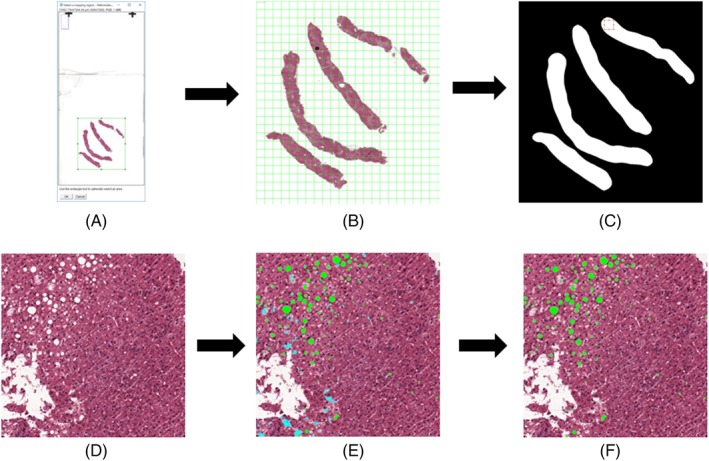
Figure 1.

Process flowchart of the steatosis quantification plugin. The whole slide image is presented to the user at a reduced resolution and a smaller region of interest, incorporating all tissue is selected for purpose of saving time (A). The selected region is automatically subdivided by the program into manageable patches (B). The region of interest is split into foreground and background and any patch with foreground in it is handled in turn (C). The patch is loaded at full resolution (D). All white areas are identified and areas that are too small or too large according to the given parameters are immediately discounted. All other white areas are judged further according to the logistic regression analysis. In (E), the green areas pass the logistic regression threshold (i.e., these are steatosis), whereas the cyan areas do not (no steatosis). Finally, only the steatosis areas are kept and measured, after which the tool calculates the steatosis proportionate area of the whole tissue (F). [Color figure can be viewed at http://wileyonlinelibrary.com]
