Figure 3.

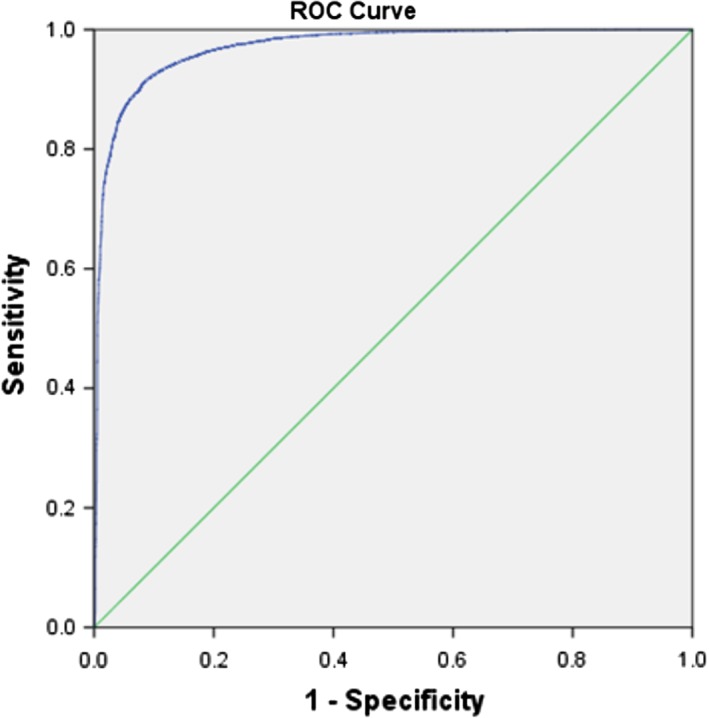
AUC for classification of steatosis. Cut offs of included size and roundness parameters were determined by logistic regression analysis on the test set. [Color figure can be viewed at http://wileyonlinelibrary.com]

AUC for classification of steatosis. Cut offs of included size and roundness parameters were determined by logistic regression analysis on the test set. [Color figure can be viewed at http://wileyonlinelibrary.com]