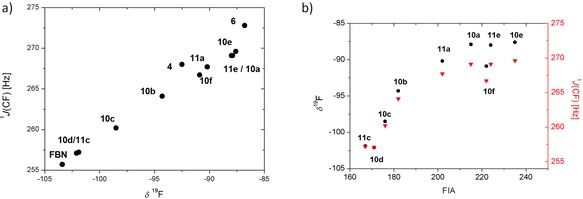
Figure 7.

a) Plot of the 1 J(CF) coupling constants versus the 19F NMR chemical shifts of nitrilium ions 6, 10, 11, and ylide 4. A line fit using all eleven data points results in the following statistics: 1 J(CF)=(0.91±0.05) Hz × δ 19F + (350.27±4.62) Hz; R 2=0.97. b) Plot of δ 19F (black circles, left axis) and 1 J(CF) (red triangles, right axis) data for nitrilium ions 10 and 11 versus FIA calculated for the corresponding cations 2 and 9 by using reaction (1) in Scheme 2.
