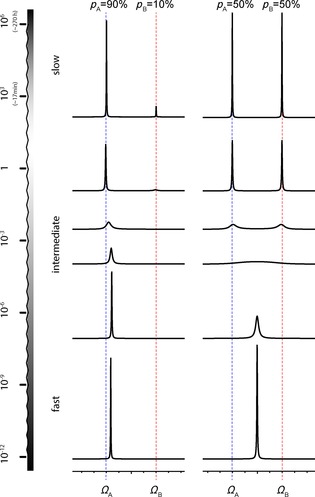
Figure 2.

Effects of exchange occurring in different timescales on lineshapes in NMR spectra. The dashed blue line indicates the chemical shift of a ground state conformer (GS, A), while the alternative conformer (ES, B) has a chemical shift indicated by the dashed red line. From top to bottom, the exchange rate k EX becomes faster with respect to the chemical shift difference ΔΩ between those two conformers. The effect of a population difference is compared (left: population ratio p A /p B=90:10, while on the right, the populations were set to 50:50). Spectra simulated with SpinDynamica.18
