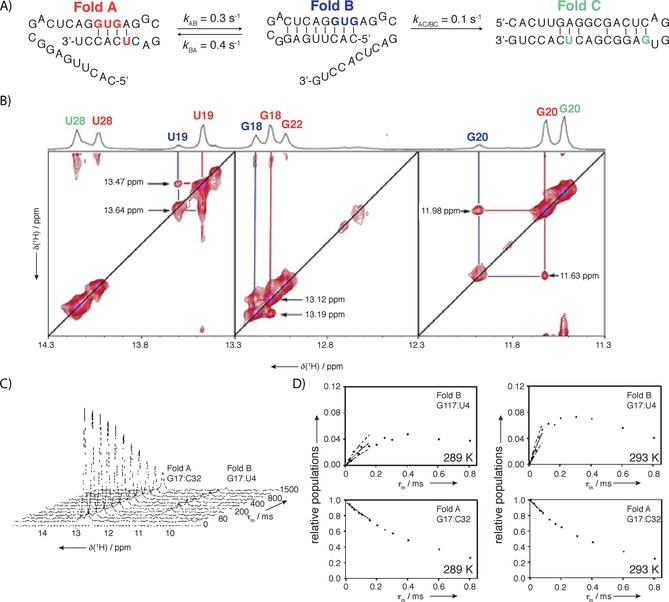
Figure 8.

A) Example of EXSY measurements for a 34‐mer tristable RNA that was designed as model to estimate time requirements for more complex RNA folding. B) Combination of differently 15N‐labeled samples helped with resonance assignment and reduced signal overlap. 2D 1H,15N EXSY experiment was used to detect cross‐peaks for different interchanging folds. 2D 15N EXSY spectrum recorded at mixing time of 400 ms showing exchange peaks between fold A and fold B, but not between fold C. C) Series of 1D 1H detected 15N EXSY spectra showing decrease of intensity of H1 G17 of fold A and increase of intensity of H1 G17 of fold B as magnetization is transferred from fold A to fold B. D) Build‐up and decay of G17 signal at two different temperatures enabled determination of activation energy for the process. The refolding rates were strongly affected by an entropically favorable preorientation of the replacing strand. Two hairpins exchanged on the observable timescale, while the least‐stable fold was static on the timescale, leading to the conclusion that exchange of fold C with the other two folds was slower. Reprinted with permission from ref. 44.
