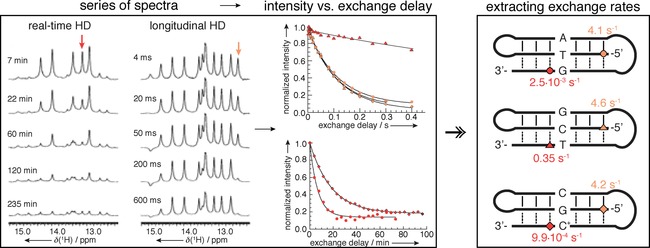
Figure 9.

Concept of H‐D exchange experiments. A series of spectra are recorded after transfer of the sample in D2O (left) or with different delay after magnetization transfer to water (middle). Normalized intensity of the signals in the imino region is plotted against the exchange delay and fitted to exponential decay to extract nucleotide‐specific exchange rates. Reprinted with permission from ref. 50.
