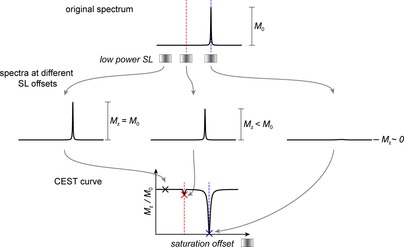
Figure 10.

Acquisition of a CEST curve. Top: illustration of the appearance of the 1D spectrum representing a system of slow exchange with a small population of the alternative/excited conformer is shown. The observed line is mostly defined by the GS chemical shift. Middle: low‐power spin lock is chosen and multiple 1D spectra, each with the spin lock placed at a different offset, are recorded. The initial magnetization/intensity is obtained from a spectrum where the SL was far off‐resonant regarding the chemical shift of interest. This intensity is used as reference, M 0 value and for each recorded 1D spectrum, the intensity is measured and the ratio in comparison with the reference intensity is displayed in the CEST curve (bottom).
