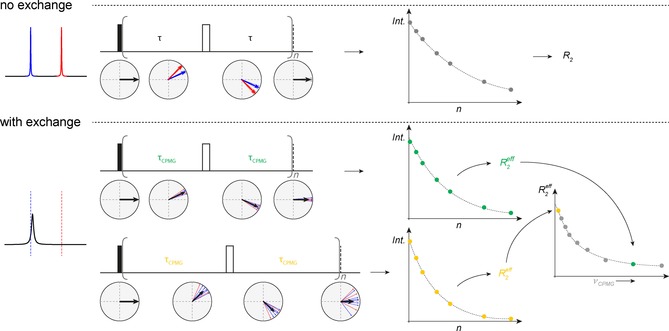
Figure 13.

Illustration of CPMG. Upper panel: scheme of evolution of net magnetization in the x,y plane and refocusing of chemical shift during a spin echo for two non‐exchanging lines at two different resonance frequencies. The experiment is carried out with a different number of repetitions of this spin echo (n) and the intensity of the NMR signal is plotted against n, the total duration of the echo, to monitor the decay of net magnetization due to non‐refocusable dephasing of the signal. The obtained data points are fitted to an exponential decay in order to obtain the relaxation rate R 2. Lower panel: same principle, but in this case including exchange contribution, R EX. The spectrum is illustrated to appear as a broadened line with a chemical shift close to the ground state chemical shift (blue line), exchanging with a smaller populated excited state with invisible chemical shift (red line). The same echo sequence is carried out for different repetitions, n. In addition to the R 2 dephasing, the signal's net magnetization now also decays due to the exchange process occurring during the spin‐echo time. An exponential fit now leads to the R 2,eff value. The measurement is then repeated with a different spin echo time and again multiple spectra are recorded for different repetitions (n) and R 2,eff value is extracted. This procedure is repeated for different spin‐echo times/CPMG frequencies and the CPMG dispersion curve is obtained.
