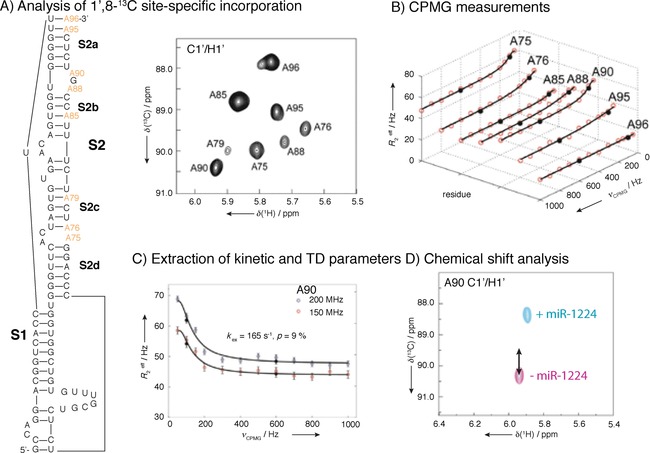
Figure 15.

CPMG studies of CCR5 pseudoknot RNA. A) Design of site and atom‐specifically labeled construct and 2D HSQC showing assignment. Line‐broadening for certain nucleotides indicates exchange. B) 13C CPMG profiles of 8,1‐13C‐labeled adenine nucleotides. CPMG experiments were performed at 13 different CPMG frequencies at 600 and 800 MHz, yielding total experimental times of ≈70 h. C) 13C CPMG RD profiles of A90 ribose C1′ carbon of the CCR5 RNA at 150 (red dots) and 200 (blue) MHz 13C Larmor frequency. Black circles represent repeated experiments and solid lines are the best fits of the CPMG profiles. D) 2D HMQC spectrum of NMR titration of the ligated CCR5‐A90 RNA with miR‐1224. NMR chemical shift perturbation analysis of the CCR5‐RNA and microRNA 1224 complex indicated that A90 of CCR‐5 exhibit similar changes in chemical shift as observed in the excited state (black arrow) and identified an A88–A90 bulge as miRNA interaction site. Reprinted with permission from ref. 85.
