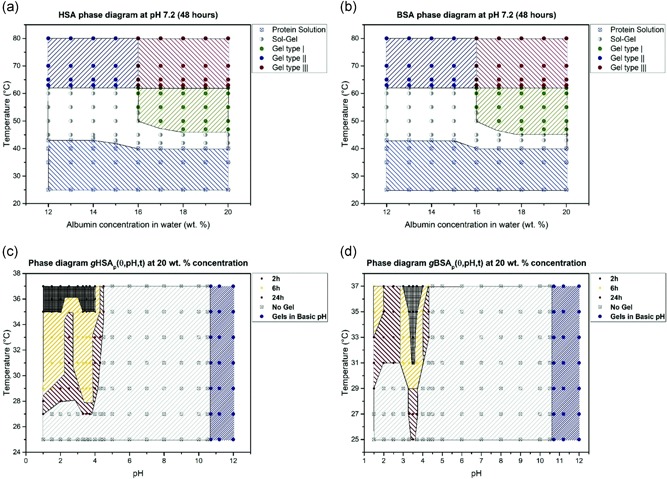
Figure 2.

Phase diagram of (a) human serum albumin (HSA) and (b) bovine serum albumin (BSA) after 48 hr of heating, at different concentrations and at neutral pH. (c) Phase diagram for 20% w/v HSA solution at varying pH values and heating times. Gels at high pH values (pH > 10.6) form in less than 2 hr at room temperature. (d) Phase diagram for 20% w/v BSA solution at varying pH values and heating times. Image reproduced with permission from Arabi et al. (2018)
