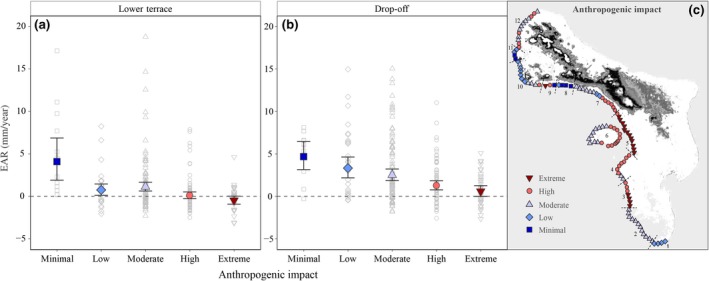
Figure 3.

Relation between the degree of anthropogenic disturbance and estimated reef accretion. The degree of anthropogenic impact is classified from minimal to extreme (colours and symbols). Left and middle panels (a, b) display mean EAR (mm/year) per impact level (large coloured symbols) for both reef zones, error bars indicate the 95% confidence intervals. Grey open symbols indicate EAR for the individual transects. Right panel (c) shows the map of Bonaire with the degree of disturbance for each site given in colours and symbols corresponding to those of the other two panels. Dotted lines and numbers (1–12) define the coastal subregions
