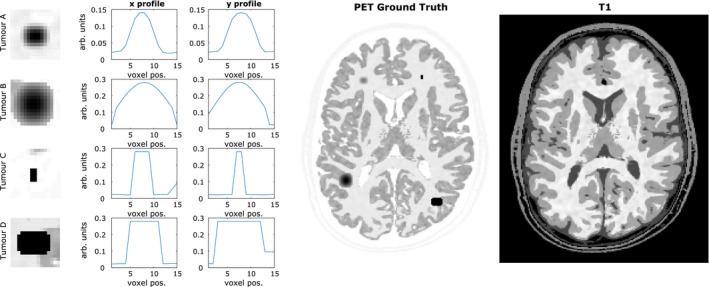
Figure 2.

(Left) Simulated positron emission tomography (PET)‐unique high‐intensity regions (tumors A, B, C and D) that differ in structure to the corresponding regions in the T1 magnetic resonance (MR) phantom. (center) Simulated [18F]fluorodeoxyglucose (FDG) PET phantom based on the BrainWeb phantom, with the four PET‐unique high‐intensity regions added. (right) T1 image. All images are shown at MR resolution. The gray matter intensity value shown in the tumor profiles is approximately 0.1 arbitrary units. [Color figure can be viewed at http://wileyonlinelibrary.com]
